An Order of Magnitude in Cost Estimates: Automatic Decarbonization in the IEA Baseline
June 9th, 2008Posted by: Roger Pielke, Jr.
Last week I mentioned the conclusions of the IEA Energy Technologies Perspectives report. I have had a chance to look at the full report in some depth, with an eye to the assumptions in the report for the spontaneous decarbonization of the global economy.
All assessments of the costs of stabilizing concentrations of carbon dioxide start with a baseline trajectory of future emissions. The costs of mitigation are calculated with respect to reductions from this baseline. In the Pielke, Wigley, and Green commentary in Nature (PDF) we argued that such baselines typically assume very large, spontaneous decreases in energy intensity (energy per unit GDP). The effect of these assumptions is to decrease the trajectory of the baseline, making the challenge of mitigation much smaller than it would be with assumptions of smaller decreases in energy intensity (and a higher baseline trajectory). Obviously, the smaller the gap between the baseline scenario and the mitigation scenario, the smaller the projected costs of mitigation.
The annotated figure below is from the IEA ETP report (Figure 2.8, p. 74), and shows the assumptions of decreasing energy intensity in the baseline scenario (BASELINE), as well as the two mitigation scenarios (ACT [emissions stabilized at current values] and BLUE [emissions half current values]).
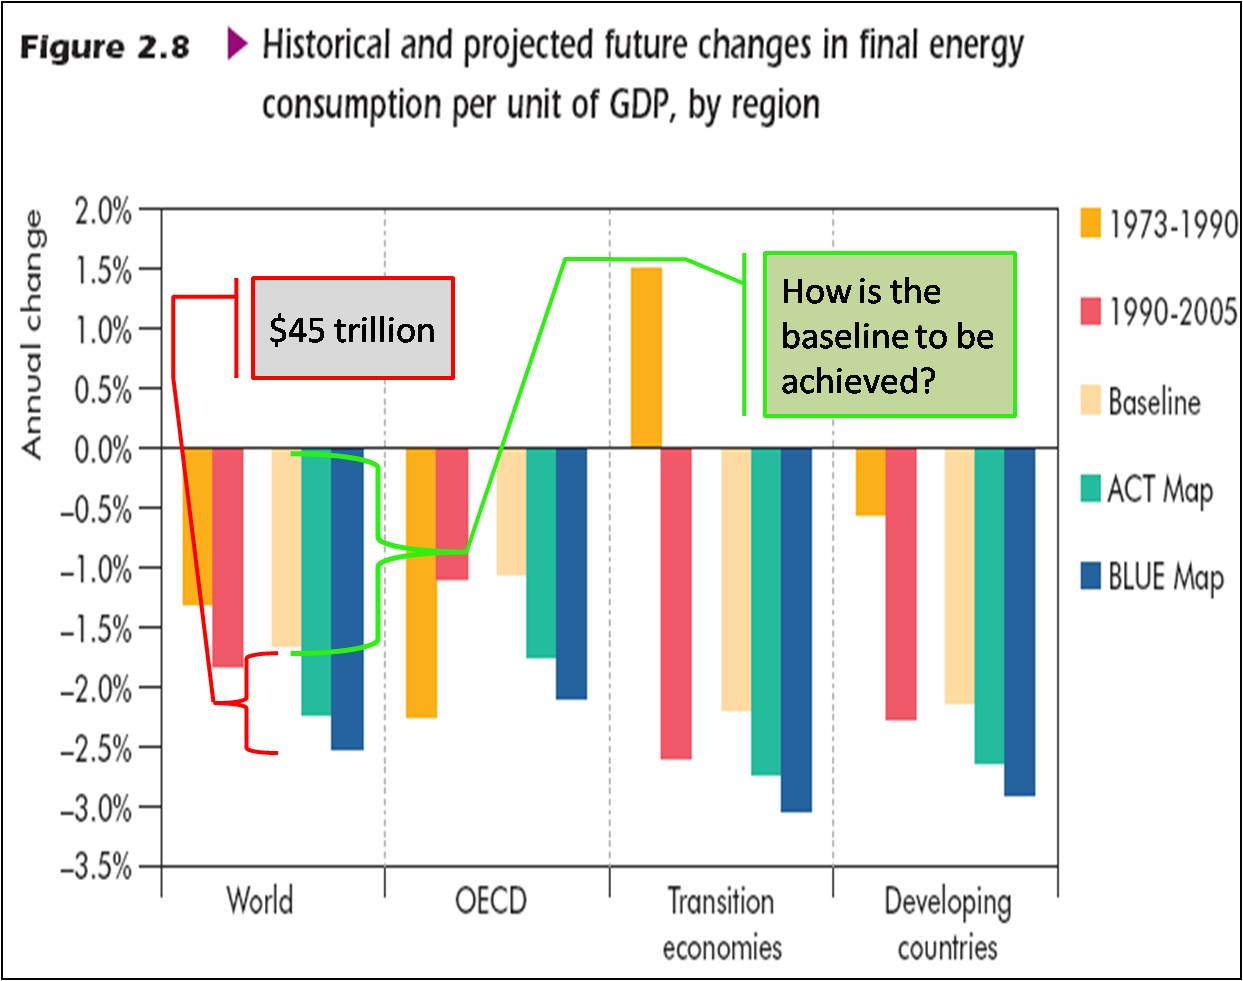
In the annotation I show with the red call out the difference between the BASELINE and BLUE scenarios, which the report identifies with a cost of $45 trillion. The magnitude of this difference is about 0.8% per year. However, the report assumes that about twice this rate of decarbonization of the global economy will happen spontaneously (i.e., the magnitude of the BASELINE reductions in energy intensity). With the green call out I ask how the baseline is actually to be achieved.
In numbers, the BLUE scenario assumes that by 2050 a trajectory consistent with stabilization at 450 ppm carbon dioxide will require reductions in emissions from 62 Gt carbon dioxide to 14 Gt. But what if we use a “frozen technology” baseline as recommended in PWG?
Using the assumptions from Annex B of the report for global economic growth (4.2% to 2015, 3.3% 2015-2030, and 2.6% 2030 to 2050 — we could play with these assumptions as well) results in a frozen technology baseline of 115 Gt carbon dioxide. Thus, 53Gt of carbon dioxide are assumed in the BASELINE to be reduced by the automatic decarbonization of the global economy. This spontaneous decarbonization will occur without any of the technologies proposed in the report to get from the baseline to the mitigation level (otherwise the report would be double-counting the effects of these technologies). What these technologies are is anyone’s guess, as the report does not describe them.
If the world does not automatically decarbonize as projected in the IEA baseline, then the costs of mitigation will be considerably higher. By how much?
If we take the report’s marginal cost estimate of $200 to $500 per ton for mitigating carbon dioxide, then a simple estimate of the full costs from a frozen technology baseline would be an additional $210 to $530 trillion above the $45 trillion cited in the report. Yes, you read that right.
What if the assumption of automatic decarbonization was off by only 10%? Then the additional cost would be an additional $21 to $53 billion, or about the same magnitude of the IEA’s total cost estimate of mitigation (i.e., of moving from the BASELINE to the BLUE trajectory) .
What does this exercise tell us about costs estimates of mitigation?
1. They are highly sensitive to assumptions.
2. Depending on assumptions, cost estimates could vary by more than an order of magnitude.
3. We won’t know the actual costs of mitigation until action is taken and costs are observed. Arguments about assumptions are unresolvable.
Meantime, it will be easy to cherrypick a cost for mitigation — low or high — that suits the argument that you’d like to make.
Anyone telling you that they have certainty about the future costs of mitigation — whether that certainty is about high costs or low costs — is not reflecting the actual uncertainty. Action on mitigation will have to take place before such certainty is achieved, and modified based on what we learn.
June 9th, 2008 at 5:39 am
Roger: You say “spontaneous” they say “historical.” I think your word choice is misleading.
As I have commented before, it is irrational to assume technology is frozen — that people won’t even naturally continue adopting cost-effective existing technologies or improving them.
BTW, given how high energy prices are now and likely to be in the future, I think their assumptions are more than reasonable.
June 9th, 2008 at 7:50 am
Hi Joe-
“Historical” refers to the past, and “spontaneous” refers to the future.
I’d be interested in hearing from you what actions will lead to future energy intensity declines that are not already on the EIA list for getting from the BASELINE to the BLUE scenario. Care to offer a few?
June 9th, 2008 at 8:17 am
Roger — IEA, not EIA.
Easy to do. Again, Roger, we’ve been through this. Energy intensity has historically improved without climate policy. What is wrong or dangerous about anybody assuming that will continue.
Frozen technology is not a rational base case since technology is not frozen. So let’s take two examples. First, compact fluorescent light bulbs. They haven’t reached full market penetration yet. You want to assume they never will do so on their own absent climate policies. I think that makes no sense.
Second, energy intensity gains have historically been HIGHER than assumed by IEA in their base case during times of high energy prices. Well, energy prices have gotten unbelievably high in the last two years, and we are already seeing a first every year over year decline in U.S. VMT.
Can we expect that high oil prices will spontaneously lead people to purchase more hybrids, small cars and diesels? Of course. No climate policy needed.
Indeed, the best way to see the expected impact of this is to look at the U.S. EIA’s change in energy demand forecast from last year’s annual energy Outlook to this year’s, which just came out.
They dropped their annual projection of electricity demand growth from 1.8% per year through 2030 to 1.1% per year! And they are still assuming oil prices in 2030 considerably lower than they already are now!
June 9th, 2008 at 9:25 am
Joe-
Your example highlights the problem –
The IEA report already allocates compact fluorescent lighting to achieving the BLUE scenario from the BASELINE. I am talking about achievement of the BASELINE.
You can’t use CFLs for both, that would be double counting, which is exactly the problem with the spontaneous improvements that we have discussed.
Please give me an action to achieve the baseline NOT assumed in achieving the difference between the BASELINE and BLUE scenarios.
June 9th, 2008 at 9:57 am
Roger –
You have misread the report. In the baseline, energy intensity improves because there is some efficiency from better technology and also some saturation of residential energy demand. The non-baseline scenarios have a lot more efficiency penetration occurring a lot faster in them.
See for instance the “Baseline scenario results by sector and region” pages 528 to 534. ON page 530, the report clearly states, “in the baseline scenario, energy consumption in the building sector grew by 1% per year in the OECD countries between 2005 and 2050. This is slower than the growth in floor areas in both the service and residential sectors, implying a continuing improvement in the energy intensity of energy consumption in the sector due to a mix of structural and efficiency effects.
On page 532, the report notes that China already has efficiency standards and that sales of some large appliances “are experiencing slower growth as they reach saturation levels. Appliance efficiency improvements are expected to offset part of the impact of rising claims ownership on residential electricity demand.”
And since you didn’t dispute my point on oil prices, I’ll also take that as an agreement on that point.
Let me note that the report rather absurdly assumes “the oil price has been capped at USD 65/bbl for the period 2030 to 2050″!!!! Indeed, they seem to think the price in the baseline will be flat at under $65 a barrel until 2030. Apparently the authors of this report didn’t read the other recent IEA reports on oil I have blogged on. Absent any strong climate policies, oil prices will be much higher — I will come back to this point in a later post.
So I think we can move beyond this particularly quibble.
June 9th, 2008 at 10:23 am
Joe-
I can see why you’d like to gloss over this point.
You write, “In the baseline, energy intensity improves because there is some efficiency from better technology and also some saturation of residential energy demand.”
Can you humor me my explaining what ‘better technologies’ you are referring to that are not already used in the mitigation scenarios that result in an energy intensity reduction of 1.8% per year for 45 years? Put another way, I need 15 wedges worth of emissions reductions to even get to the BASELINE. Or are they just going to occur automatically?
June 9th, 2008 at 10:46 am
Roger — Now you are just wasting everybody’s time. I already quoted the report itself saying efficiency is in the baseline. Lots of low-carbon technologies are.
Did you bother to even read the report? It has VERY detailed technology timelines as to what is in the baseline and what isn’t.
Here are a few examples from the report. This is all in the baseline (please note this isn’t everything — I do have useful things to do other than reading the report for you).
* 160 GW of Generation III+ nuclear plants by 2050.
* 400 GW of wind
* Huge amounts of efficiency in electricity and buildings (since “technologies already commercial”) — “improved thermal performance of new and existing dwellings,” “appliance efficiency improvements”
* Improvements in heat pump technology that increase energy efficiency and carbon footprint by 5%.
* 650 GW of solar space and water heating
* Huge amounts of efficiency in transportation — 10% to 25% lower fuel use in 2050 from LDV fuel economy improvements. 5-15% market share of hybrids in 2050
* 1000 Mtoe of 2nd generation biofuels
I think that is enough, don’t you?
June 9th, 2008 at 11:37 am
Joe-
You continue to show that you do not understand the meaning of a BASELINE scenario. The numbers that are provided in the report (or by you) do not add up to reductions of 53 GtCO2. Consider:
*Solar makes almost no contribution to the BASELINE (p. 367) [Once again by including solar in the BASELINE you confuse the BASELINE and MITIGATION scenarios]
*Wind contributes 2% to the BASELINE (p. 343), and thus cannot by definition provide a large contribution to reductions implicit in the BASELINE
*Nuclear increases by very little (1 TW/yr) (p. 284), and similarly cannot produce a large contribution to EI declines
*Assumed decreases in fuel use are exactly the problem — they are just convenient assumptions, how will they occur separately from the ? (p. 428) How will vehicle miles traveled be limited to a tripling as the global economy increases by a factor of 4? Such assumptions are convenient, but they influence the conclusions in significant degree.
You have provided maybe 3-4 GtCO2 (1+ wedge) worth of reductions in your list above, even including the unsupported assumptions. Is that enough? No, it is not. You need about 10-12 more wedges.
When we are talking about the accuracy of a $45T price tag is it a waste of time to see if it is an accurate estimate?
It is amazing that you endorse the results of a report that (a) calls for a range of technological breakthroughs requiring massive new investments in RD&D, (b) requires 90% penetration of fuel cell vehicles (for its $200/ton marginal cost estimate), (c) has 15 GtC of built-in wedges (but not explanation for the majority of these).
June 9th, 2008 at 11:57 am
re: jrommat June 9, 2008 10:46 AM
And the actual real-world right-now rate at which any of those are being implemented is?
Have the final designs of any Generation III+ nuclear plant been reached?
Do you have any data from the past relative to the rates at which technologies have made market penetration? Especially retro-fitting existing homes with upgraded technologies.
“Huge amounts” is kind of difficult to do arithmetic with.
I think one rule-of-thumb that have have seen over the years is as follows. It requires about 50 years for an existing technology to be replaced by one that provides existing capabilities plus some additional benefits. One that simply replaces an older one and having no additional directly-tangible benefits requires much longer time scales. What has been the rate at which high-efficiency heating and cooling systems are retro-fitted into existing buildings? Or, even new construction?
Consider water power being displaced by steam being displaced by electricity. And wood displaced by coal/fossil being displaced by fission. The last one is a most excellent data point, as significant market penetration has yet to be attained, even after 50+ years. And it is being counted on to provide very significant displacement of fossil fuels, in less than 50 more years.
Thanks.
June 9th, 2008 at 1:02 pm
Those wedges should be presented with the projected timeline required to attain the assumed outcome. And the actual results can be used to validate the projections as functions of time. This should be broken down to the level of each individual element in the wedge.
I’m thinking that if history offers any guidance, the actual performance will slowly but surely evolve to the case for which 90% of the projected outcome will need to be met in the last 10 % of the time.
June 9th, 2008 at 4:44 pm
Roger — This is tedious. You keep ignoring what the IEA writes and restating your incorrect comments.
The IEA report clearly states, “in the baseline scenario, the combined impact of both structural and efficiency effects leads to a reduction in final energy intensity of 1.7% per year.”
If you’d like to know exactly what changes occur year by year in terms of technology and structural change — ask the IEA.
I believe that the energy economists at IEA know how to do a baseline. You apparently don’t. Fine. Time for you to argue with them.
But I’ve said I don’t agree with all their assumptions. They are wrong about fuel cells. That’s one reason their costs are too high — duh!
And they have a very odd definition of breakthrough, as I will show.
Finally, they don’t have “15 GtC of built-in wedges.” They assume a continuation of historical trends that we’ve seen since 1973 — as they explain in great detail. Those trends occurred without climate policies. And given that oil prices are in fact now DOUBLE what IEA modeled, I’m thinking they are probably being the conservative by modeling “a reduction in final energy intensity of 1.7% per year.”
But good luck in your efforts to get more details out of them. Perhaps they have detailed spreadsheets they will share with you!
June 9th, 2008 at 4:57 pm
FWIW, I think everyone here is demonstrating the problem with the projection of energy production and utilization efficiencies under the influence of future market prices.
If the cost of oil is $65/BBl (is this in constant 2008 dollars?) from 2030-2050, how many alternative (and I’m not talking about exotic) sources of energy and related energy efficiency will either become more economical, not change or more expensive on the margins for local developed and developing economies at higher prices? And how can anyone project energy production and prices that far in advance?
Mr. Pielke’s questioning of the assumptions of the report is valid. Slight variations in projections, compounded annually for 30-50 years, skew any estimates of the future costs and energy efficiency. But the rewards of any scenario (CO2 reduction/increment of energy efficiency) are vague in the long term. So the benefits are possibly very weak while the costs could grow astronomically. We could bankrupt ourselves into abject poverty in the future in an effort to preserve growth in our future living standards.