What Does the Historical Relationship of Atlantic Sea Surface Temperature and U.S. Hurricane Damage Portend for the Future?
October 22nd, 2006Posted by: Roger Pielke, Jr.
Every four years the World Meteorological Organization (WMO) holds a workshop that brings together forecasters and researchers from around the world who focus on tropical cyclones (which are called “hurricanes” in the Atlantic and Eastern Pacific). The sixth such workshop is taking place in Costa Rica at the end of November and in preparation for that workshop experts in a wide range of issues related to tropical cyclones have prepared number of background reports (links found below). Supported by an all-star international team, I was in charge of preparing a background report on “Factors Contributing to Human and Economic Losses.” The WMO has now posted these background papers online. In this post I’d like to discuss one aspect of our report – the relationship of Atlantic sea surface temperatures (SSTs) and U.S. hurricane damage.
In particular, our report presents two different perspectives on the relationship of SSTs and damage. One perspective, mine, is that there is absolutely nothing in the historical record that suggests a relationship between SSTs and damage. Such a relationship may materialize in the future, but one cannot use the past to project such a relationship, it must be based on some other considerations. A second perspective is presented by my friend and colleague Eberhard Faust of Munich Re. He argues that there is “remarkable evidence for global warming effects on losses.” Because we disagree on this issue, in our report we presented our two different perspectives.
Our two perspectives are presented on pp. 548-550 (Pielke) and pp. 551-555 (Faust) of our report (available here in PDF), and are together in a final section titled “Differing views of the role of global warming on losses” which falls at the very end of our 23 page report at pp. 547-555. The brevity of these two analyses is such that it might make for a very good case study for students to examine in a course in statistics or atmospheric sciences. Which analysis is more compelling and why?
My argument is based on the following graphs.
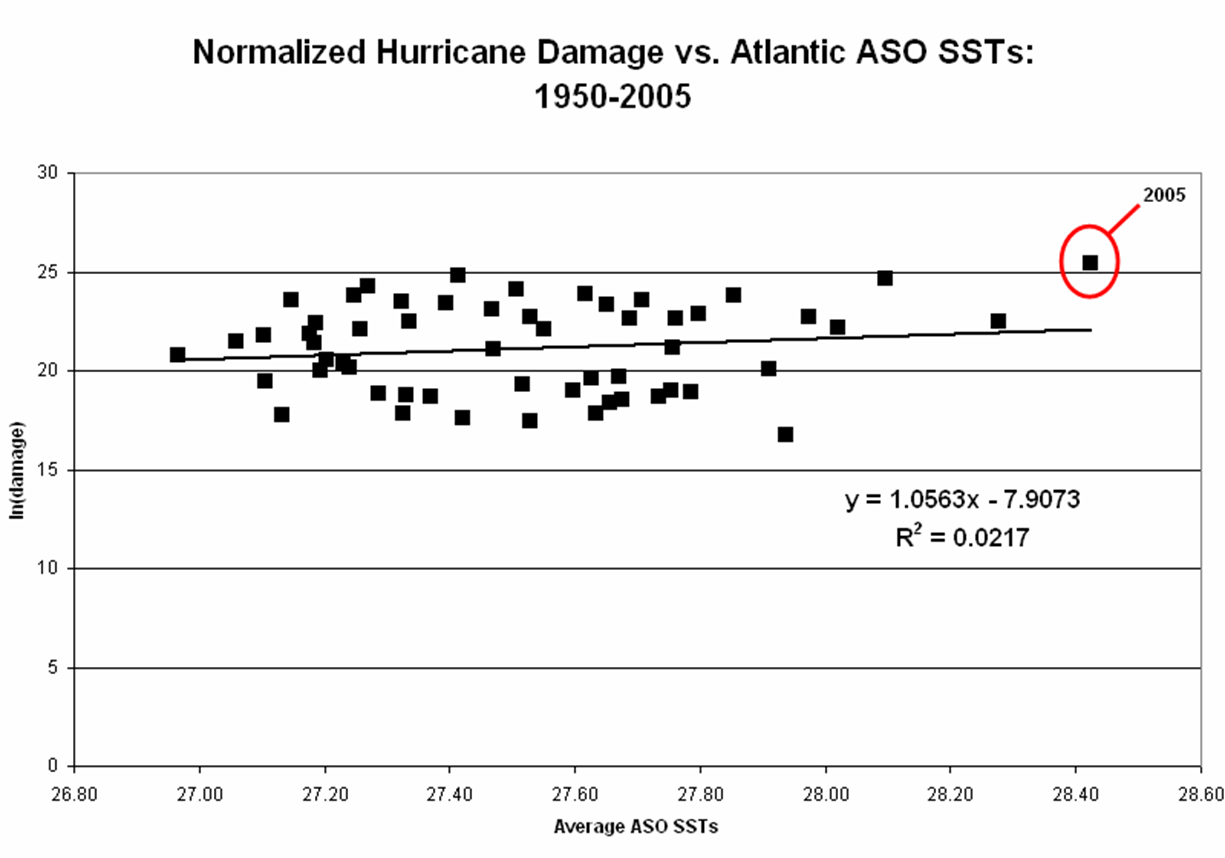
In the paper I argue:
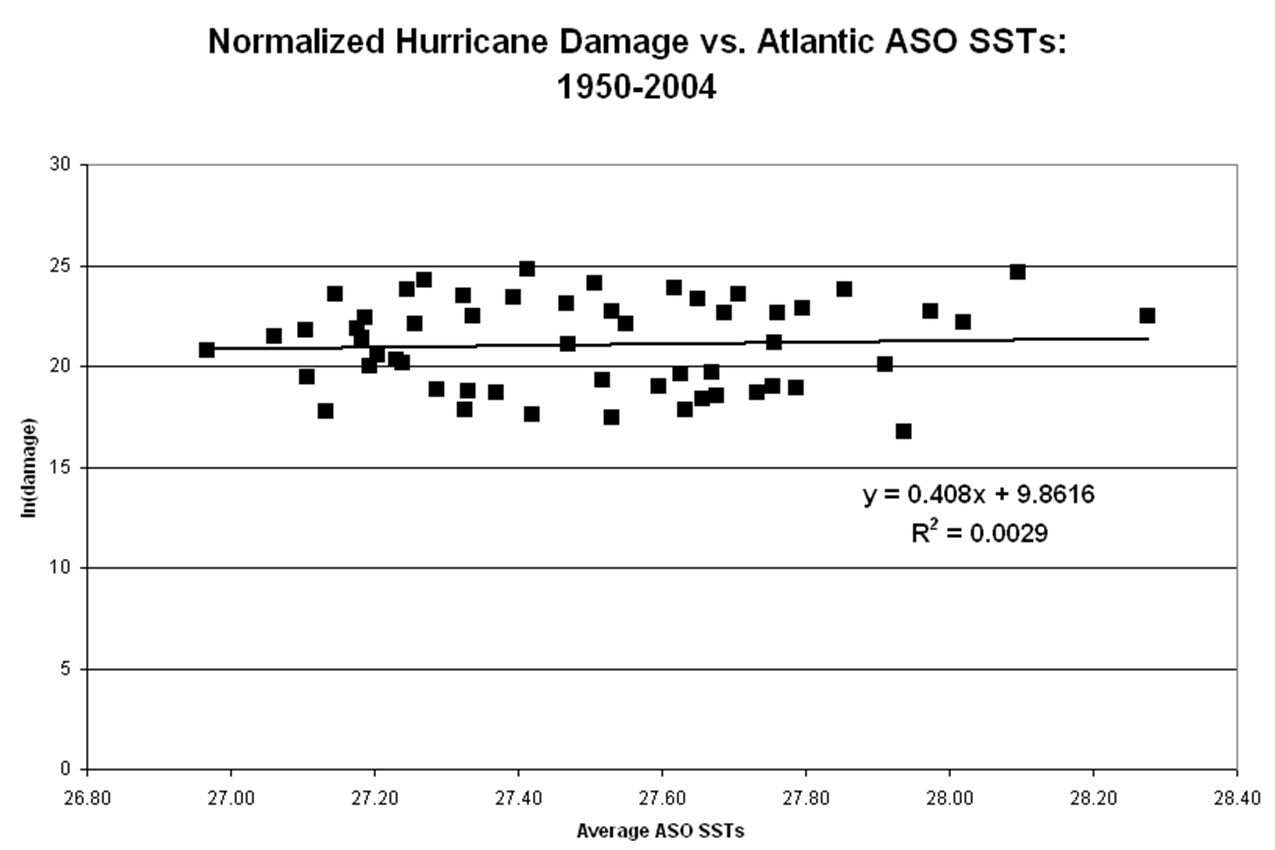
Figures 5.2.7a and 5.2.7b shows the lack of meaningful relationship between normalized U.S. hurricane damages (NHC data, transformed with the natural log) and North Atlantic [August, September, October = ASO] sea surface temperatures 1950-2005 and 1950-2004. The r-squared values are low with or without 2005 included, and the regression results are not statistically significant (p = 0.28 and 0.69 respectively). There is consequently no systematic evidence that higher SSTs are systematically associated with larger losses.
Eberhard’s begins with the following graph:
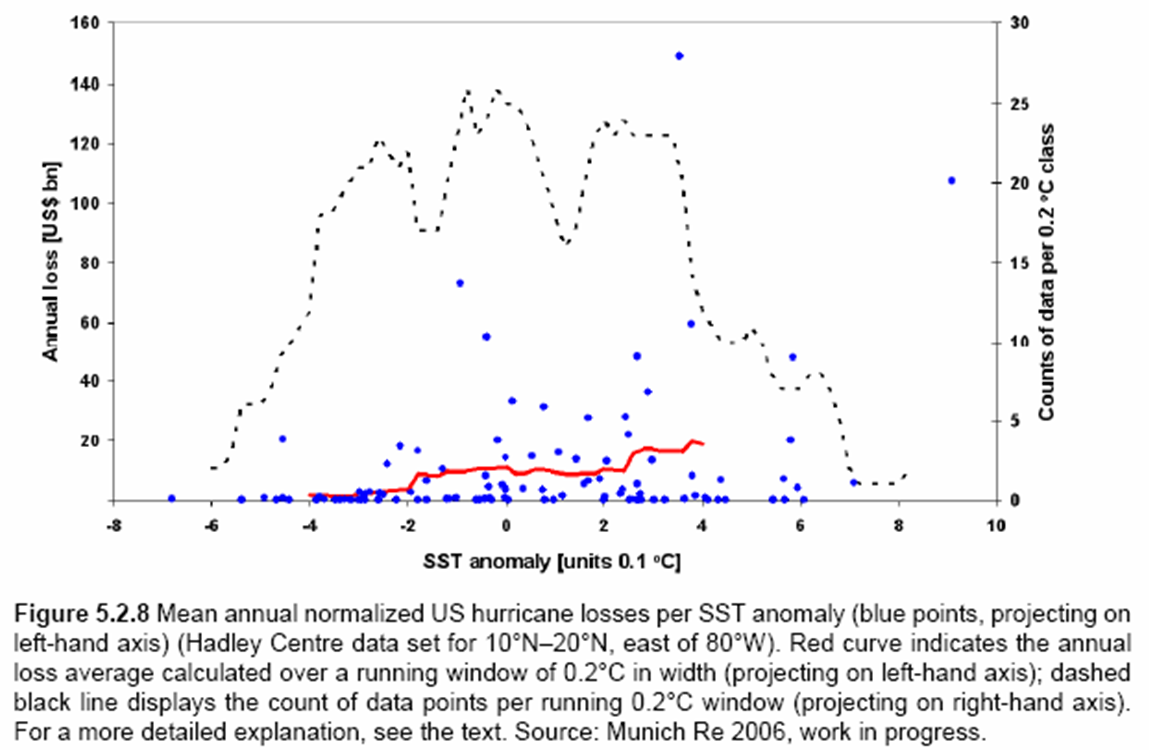
In the paper he argues:
But if analyzed more closely, the normalized loss data show nonetheless systematic changes over time. Fundamental to these changes is the presence of a correlation between normalized annual losses and June-October annual tropical sea surface temperatures. Munich Re analyzed the respective annual SST anomalies and annual normalized losses since 1900. Figure 5.2.8 simply displays the normalized losses against the SST anomalies. Also, the average loss calculated for a running window of 0.2°C in width is displayed (red line). The running average is shown over a range where the 0.2°C windows are populated densely enough (at least 12 data points, i.e. half the maximum population, see the dashed black line). A remarkable general increase in average annual normalized losses with increasing SST can be observed over the -0.4°C to +0.4°C anomaly range. Spearman’s rank correlation coefficient, which is independent of the distributions involved, gives 0.26 for the range from -0.4°C to +0.4°C and 0.28 for all of the data.
We both think that our respective analyses will be compelling. If you are interested, please read both analyses in full. Eberhard was a key participant in our workshop held last spring on Climate Change and Disaster Losses, the report of which you can find here. I’d be happy to discuss the two analyses in the WMO report in the comments if there is interest. Do note that neither of our perspectives have yet appeared in the peer-reviewed literature, but stay tuned.
For those of you interested in the other background reports prepared for the WMO workshop, they can be found here. In particular have a look at the Topic 4 “Climate variability and seasonal prediction of tropical cyclone activity/intensity” which includes a comprehensive literature review led by Tom Knutson (Special Topic 4a is also relevant). It is safe to conclude that debate persists on this subject. Topic 5 is relevant to those of you interested in policies related to tropical cyclones. We say it often enough here, but bears repeating — the debate over human-caused climate change and tropical cyclones is scientifically interesting and has become caught up in the politics of global warming, but there is no evidence that energy policies can ever serve as an effective means of modulating future hurricane damage given that the overwhelming factors responsible for increasing damage have been and will continue to be the ever-increasing vulnerability of people and property.
October 22nd, 2006 at 7:27 pm
Hi Roger,
How do you respond to Eberhard Faust’s observations and conclusions? His observations and conclusions seem pretty solid to me:
1) Figure 5.2.8 appears to show a pretty clear increase in damage with increasing SST anamoly,
2) Figure 5.2.9 (going back to 1900) shows a positive slope,
3) The tables with losses during warm phase and cold phase years seem very compelling (that periods of increased SST have higher damages)…unless one disagrees with his characterization of the various years as being “cold phase” or “warm phase”. (Do you disagree with his lumping of the various years as “cold phase” and “warm phase”?)
Overall, his case seems pretty strong to me. (Not that his point diminishes at all from one of your points…which is that societal aspects dramatically outweigh the effects of SST.)
Mark
October 23rd, 2006 at 3:05 am
Roger,
A couple of tecnical questions remain unclear to me.
First, the red curve in Figure 5.2.8 is based on the count of damage losses in running 0.2C-windows in the range -0.4C to 0.4 C? Does it therefore contain just 4 degrees of freedom?
Other question that I think is relevant
here is that statistical significance is not sufficient. The amount of explained variance is the critical number, and from Figure 5.2.8 seems to be quite low.
October 23rd, 2006 at 6:56 am
Mark-
Thanks. A few replies.
1. See the first paragraph of my section. One should always be cautious about relationships found when “binning” data — especially when the original (non-binned) relationships don’t exist!
2. What are the p-values (statistical significance) for such a “trend”? (Hint see figures 5.2.7a and b as discussed on p. 548). There is no statistically significance.
3. There is some arbitriness in such binning. For instance, 1926 the largest loss year falls right on the border of warm/cold phases. Rather than binning the data in this manner, which may or may not make sense, take a look at 5.2.7a and b. Where is the relationship?
Thanks!
October 23rd, 2006 at 7:09 am
Hi Eduardo-
1. The red line in 5.2.8 shows the moving average over a moving 0.2 degree window. Note that the relationship appears to break down outside of -0.4 to +0.4. You are absolutely correct that there are very few degrees of freedom shown here.
2. Figure 5.2.8 presents the same analysis as 5.2.9, although with (a) untransformed damage data (it is not normally distributed), (b) a moving average rather than a simple regression, and (c) excluding some of the data points. In my view all of (a), (b) and (c) are statstically improper ways to treat the data in this situation.
Figure 5.2.9 presents results that are contrary to 5.2.8 (and no p-value is reported). This suggests that the conclusions drawn from 5.2.9 are a function of the data handling/binning, not a significant relationship of damage and SST.
Thanks!
October 23rd, 2006 at 12:07 pm
Roger,
If there was ever a case where Ockham’s razor applied, this would be it. Your analysis appears straight forward and reasonable. The Faust analysis seems almost tortured by comparison, as if he were trying to find some way to arrange the data to get the results he wanted.
Furthermore, the conclusion “…that if the increases in tropical Atlantic SSTs were to continue in the long term due to anthropogenic climate change, we would have to expect a shift towards hurricane loss distributions with ever increasing high-loss portions” is not supported. Such a statement falsely assumes that increasing GHGs would only impact tropical SSTs, leaving all other factors governing tropical development and storm tracks unchanged.
Finally, the evidence strongly suggests that SST changes have such a minor role (if any) on US damages, that the difference has already been exceeded by improvements in building design and materials, even without the implementation of stricter building codes. Or put another way, if the cost of switching from roofing nails to roofing screws was the same as the cost of preventing any additional rise in GHGs, switching to roofing screws would be the better investment for hurricane damage mitigation!
October 23rd, 2006 at 5:30 pm
Roger,
just being an amateur in climate science and statistics I’m interested in where the normalized data used in these graphs could be obtained. I’d say this data would be a requirement for any assessment.
Some questions remain (at least for me):
1) The handling of zero losses is somehow unsatisfactorily. Binning well below average losses as zero should correspond to binning well above average losses as a corresponding maximum as well. I feel this comes more close to the rank test you’ve applied.
2) How does regional restriction of Hadley SSTs (10N…20N…) influence the results?
3) How sensitive are the results with respect to the applied normalisation (-formula) of losses?
4) How sensitive are the results with respect to the acquisition of losses in earlier times?
October 23rd, 2006 at 9:19 pm
Hi Roger,
I think you are both partially correct, but neither analysis is compelling.
The important limitation is the failure to disaggregate the loss data. A large annual loss can be the result of many small losses or one big loss, and the number of loss events should be independent of the magnitude of the event.
We did a study that will be published soon looking at the predictability of insured losses from US hurricanes (Atlantic basin, only). It is available at http://garnet.fsu.edu/~jelsner/www under Research. The bottom line is that preseason Atlantic SST influences the expected annual loss given an event, but not the probability of an event itself. Moreover, extreme annual losses are conditional on preseason values of the NAO and ENSO, but not SST.
Although we are using preseason covariate information (as opposed to contemporaneous), I think our analysis is the more compelling one.
Best,
Jim
October 23rd, 2006 at 11:21 pm
Hi Jim- Thanks very much for the link to your paper. I have responded with another post on this questioning your analysis. Perhaps we could compare data? We do have a big difference in the numbers. Thanks!
October 23rd, 2006 at 11:23 pm
Wolfgang- Thanks for your comments. I’ve posted the data in the next installment of this discussion. Note that there are no zero loss years in the data I am using. Thanks!
October 25th, 2006 at 7:13 am
Roger, Andrew Dessler’s recent comments on Gristmill about “Lessons from Katrina” seem relevant, if not directly on thread: http://gristmill.grist.org/story/2006/10/24/213640/77.
October 25th, 2006 at 8:06 am
Thanks for the link Tom. I like your comments on that thread. I am not a big fan of arguments that start with hurricanes/Katrina and end up with using hurricanes as the basis for justifiying emissions reductions. Andrew’s approach is creative and not incorrect in my view. But if the problem is hurricanes, then policies should focus on that issue. They are in my view two important topics, but separate. Thanks!