This is Just Embarassing
April 11th, 2007Posted by: Roger Pielke, Jr.
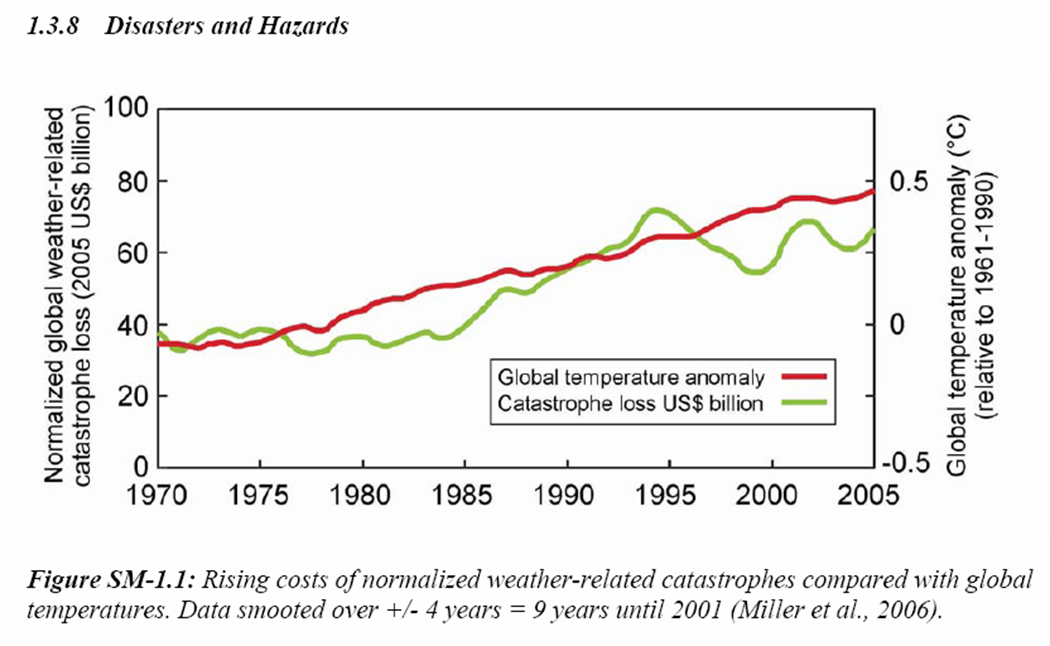
The Figure below is found in the IPCC WG II report, Chapter 7, supplementary material (p. 3 here in PDF). I am shocked to see such a figure in the IPCC of all places, purporting to show something meaningful and scientifically vetted. Sorry to be harsh, but this figure is neither. [Note: The reference (Miller et al. 2006) is not listed in the report (pointers from readers would be welcomed).]
I am amazed that this figure made it past review of any sort, but especially given what the broader literature on this subject actually says. I have generally been a supporter of the IPCC, but I do have to admit that if it is this sloppy and irresponsible in an area of climate change where I have expertise, why should I have confidence in the areas where I am not an expert?
Addendum, a few of the many problems with this figure:
1. Global average temperatures do not cause disaster losses, extreme events cause disasters, mostly floods and tropical cyclones.
2. if you can’t attribute disaster losses regionally to changes in extremes, then you can’t do it globally with a metric only loosely (at best) related to extremes.
2. A 9-year smoothing in a 35 year record?
3. The IPCC has said that 30 years is not sufficient for such an attribution analysis, a 35 year record with 4 degrees of freedom probably isn’t either.
4. The Muir-Wood global dataset (if that is what is used) has huge error bars not noted here. Any global analysis should be matched with a regional summation.
5. The Muir-Wood dataset, without error bars, leads to opposite conclusions using a longer record to 1950. Why didn’t they show that? I wonder . . .
6. Studies of floods and hurricanes at the regional level, around the world, do not support a relationship of average global atmospheric temperature and disaster losses.
7. A consensus conference with experts around the world came to very different conclusions. What happened to the importance of consensus?
A more comprehensive synthesis can be found here:
Pielke, Jr., R.A., 2006. Seventh Annual Roger Revelle Commemorative Lecture: Disasters, Death, and Destruction: Making Sense of Recent Calamities, Oceanography, Special Issue: The Oceans and Human Health, Vol. 19, No. 2, pp. 138-147. (PDF)
April 11th, 2007 at 4:22 pm
Hi Roger,
You think that IPCC figure is remarkable? I guess you haven’t seen IPCC Figure S&M-XXX!
I’ve got that one covered on my blog:
http://markbahner.typepad.com/random_thoughts/2007/04/us_patents_caus.html
What I want to know is, why hasn’t that @#%& G.W. Bush protected us from the maniacs at the U.S. Patent Office? Pardon my French, but this is just beyond the pale!
Mark Bahner (pattern recognition expert)
April 11th, 2007 at 10:36 pm
Mark- Good one!
April 12th, 2007 at 8:50 am
Are those losses adjusted for inflation? I wouldn’t be surprised if they weren’t. Does anyone else think that just maybe things like population growth and an increase in developed land might be a more reasonable explanation. Is there anything in the IPCC reports that I should even care about?
April 12th, 2007 at 9:11 am
David- Thanks for your comments. I assume that these numbers are adjusted in some manner (how??) to adjust for societal changes. Lets even assume for discussion that they have done this adjustment perfectly. They figure still does not show what it purports to, and this exact same error was made by the IPCC in its previous report, which I discuss here starting on p. 144:
http://sciencepolicy.colorado.edu/admin/publication_files/resource-2449-2006.02.pdf
More generally, the basic messages of the IPCC WG I (on climate science) are widely accepted to represent the consensus of the community, so pay attention to that. WG II? I don’t know . . .
April 12th, 2007 at 9:22 am
Where’s the “coastal population” trend line?
It’s really simple – although most Climate Scientists only want “simple” when it comes to CO2’s relation to temperature.
There has been a BOOM in coastal populations going on for decades in the United States. That means that each Hurricane that comes ashore, instead of knocking over some guy’s vacation shack and a local convenience store, now affects millions of people regardless of where in the US it hits!
That alone will drive “costs” of natural disasters up!
And OF COURSE it had to stop at 2005 – 2006 cost us NOTHING in hurricane cleanup (how many years has it been since THAT happened?) and would have really destroyed their dataset!
April 12th, 2007 at 9:22 am
Roger….In the PDF file of the report, it states at the top of each page ” CONFIDENTIAL: Do Not Cite – Do Not Quote” and at the bottom left of each page it states ” DO NOT REVIEW THIS DOCUMENT”. Do you have any idea why those statements would be there?
April 12th, 2007 at 9:31 am
So, Mark, would you suggest that invention is the mother of the current political necessity for action on climate?;-]
April 12th, 2007 at 9:35 am
Stan B.- Thanks for your comment. The figure says “normalized” so I assume that the loss data has been adjusted for population and wealth.
A trend in global loss data properly normalized from 1970 will really reflects trends in US hurricane losses (and to a lesser extent floods, because these losses are so large when compared to others. For instance, Katrina was an $80B+ event)), which indeed have gone up since 1970. However, there is no such trend in US hurricane losses over the entire record of available loss data.
I am still waiting for a pointer to the Miller et al. paper, which I assume is not in the peer-reviewed literature! If we had the data we could take a close look . . . Thanks!
April 12th, 2007 at 9:40 am
Craig- That would be a good question for the IPCC. The files are on a public webpage, have been openly discussed in the media, and are widely referenced on blogs (including RealClimate) so they are well cited and quoted! Since these are the versions made public by the IPCC and also which are used to support the very public SPM, I have absolutely no problem discussing them here. Scientific claims are best discussed out in the open. Thanks!
April 12th, 2007 at 3:04 pm
Sorry, Roger. But policy makers have no choice but accept whatever the IPCC says. They cannot cherry pick as you seem to suggest. 2500 of the world’s top cannot be wrong. It’s the consensus. The science is settled and the debate is over.
April 12th, 2007 at 3:32 pm
“So, Mark, would you suggest that invention is the mother of the current political necessity for action on climate?;-]”
Yes, I’d say that. Also, I’d say correlation ***IS*** causation. IPCC Figure S&M-XXX proves that.
Bush shouldn’t fire all the U.S. attorneys. He should fire all the U.S. patent clerks. It’s the only way we can avoid more weather-related catastrophes!!!!!!!!!!!!!!!!!!!!!!!
April 12th, 2007 at 7:50 pm
Roger:
Doesn’t the following paper
http://sciencepolicy.colorado.edu/sparc/research/projects/extreme_events/munich_workshop/muirwood.pdf
(archived at your site, so I assume you know it well), indicate that even over the 1970 – 2005 period there is a significant upward trend in loss data normailized for inflation, population and GDP growth only at the national level? They indicate that US losses dominate the trend, and they have not accounted intra-country population movements. Given the huge importance of movement into coastal Florida, doesn’t this leave open the question of whether there is any trend? Is there some other relevant paper that has adequately adjusted for this effect?
Thanks,
Jim
April 12th, 2007 at 8:09 pm
Jim- Thanks for your comment and question. Yes, I know that paper very well, I discussed its use by Stern and IPCC in the following posts:
http://sciencepolicy.colorado.edu/prometheus/archives/climate_change/000973sterns_cherry_picki.html
http://sciencepolicy.colorado.edu/prometheus/archives/climate_change/001168here_we_go_again_ch.html
I discuss the US part of the record in my own paper prepared for the same workshop:
http://sciencepolicy.colorado.edu/sparc/research/projects/extreme_events/munich_workshop/pielke.pdf
The bottom line is as follows:
1. There is indeed an increase in disaster losses after accounting for societal changes in the data for the period 1970-2005.
2. This increase can be attributed to increasing hurricane losses in the US.
3. Hurricane losses show no trend for the entire data record of losses that are available adjusted in the same manner
4. Logically, anyone suggesting that there is a trend since 1970, is necessarily compelled to accept that the exact same data set shows no trend over a longer time period, and this is exactly as Muir-Wood et al. shows back to 1950 in the paper that the IPCC and Stern selectively quoted!
5. Greenhouse gases have increased steadily since the 1950s, disaster losses have not, once adjusted for societal trends.
6. Therefore greenhouse gases do not have any obvious or simple relationship with disaster losses.
7. Everyone agrees that societal factors dominate the record.
Maybe this is worth a blog post . . . Thanks!
April 13th, 2007 at 5:05 am
Re your #7: “Everyone agrees that societal factors dominate the record”
Is that in private when they are being candid and realistic or in public when they are advocating action?
If it’s just sotto voce because of the poisonous atmosphere around climate change debate then it’s not worth much.
April 13th, 2007 at 7:03 am
John S.- Thanks for your comment:
This is indeed what the IPCC WG II says! But, as we have documented here many times, many advocates of action on climate change present adaptation as an alternative to mitigation. The reality is that both must occur. Thanks.
April 13th, 2007 at 9:56 am
There is another factor not mentioned regarding the time period is the cyclic aspect of hurricane activity.
During the 2005 season some argued the large number of storms were due to Global Warming, and there were multiple responses citing the approximate 30 year cycle as being the reason for the active season.
So even if there was an increase in hurricanes over this time period, how does one filter out the effect of this 30 year cycle?
April 17th, 2007 at 4:19 am
Thanks Roger, for this discussion. It clearly points the fact that IPCC has not done enough to make an unambiguous statement on the attribution of disaster losses in their Working Group 2 Summary for Policymakers (SPM). This now leaves room for speculation based on the individual statements and graphs from underlying chapters in the report, in particular Figure TS-15, Chapters 1, 3 and 7, that all have substantial paragraphs on the topic.
As reviewer for WG2 I have repeatedly (3 times) asked to put a clear statement in the SPM that is in line with the general literature, and underlying WG2 chapters. In my view, WG2 has not succeeded in adequately quoting and discussing all relevant recent papers that have come out on this topic — see above-mentioned chapters.
Initial drafts of the SPM had relatively nuanced statements such as: “Global economic losses from weather-related disasters have risen substantially since the 1970s. During the same period, global temperatures have risen and the magnitude of some extremes, such as the intensity of tropical cyclones, has increased. However, because of increases in exposed values …, the contribution of these weather-related trends to increased losses is at present not known.”
For unknown reasons, this statement (which seems to implicitly acknowledge Roger’s and the May 2006 workshop conclusion that societal factors dominate) was dropped from the final SPM. Now the SPM has no statement on the attribution of disaster losses, and we do not know what is the ‘consensus’ here.