Real Climate on Meaningless Temperature Adjustments
June 1st, 2008Posted by: Roger Pielke, Jr.
[UPDATE]Real Climate did not like the figure shown below, so I responded to them with the following request, submitted as a comment on their site:
Hi Gavin-
I’d be happy to work from a proposed adjustment directly from you, rather than rely on the one proposed by Steve McIntyre or the one you point to from The Independent.
Thompson et al. write: “The new adjustments are likely to have a substantial impact on the historical record of global-mean surface temperatures through the middle part of the twentieth century.”
It is hard to see how temperatures around 1950 can change “substantially” with no effect on trends since 1950, but maybe you have a different view. Lets hear it. Give me some better numbers and I’ll use them.
Their response was to dodge the request:
Response: Nick Rayner, Liz Kent, Phil Jones etc. are perfectly capable of working it out and I’d suggest deferring to their experience in these matters. Whatever they come up with will be a considered and reasonable approach that will include the buoy and drifter issues as well as the post WW-II canvas bucket transition. Second guessing how that will work out in the absence of any actual knowledge would be foolish. – gavin
But doesn’t speculation that no changes will be needed to the IPCC trend estimates count as “second guessing,” or pointing to a graph in The Independent as likely being correct?
Similarly, in the comments below climate scientist James Annan criticized the graph in this post and when asked to provide an alternative adjustment, he declined to do so.
If these guys know what is “wrong” then they must have an idea about what is “right”.
Real Climate writes an entire post responding to Steve McIntyre’s recent discussions of buckets and sea surface temperatures, explaining why the issue doesn’t really matter, but for some weird reason they can’t seem to mention him by name or provide a link to what they are in fact responding to. (If the corrections don’t matter, then one wonders, why do them? Thompson et al. seemed to think that the issue matters.)
Real Climate does seem have mastered a passive voice writing style, however. Since they did have the courtesy to link here, before calling me “uninformed” (in deniable passive voice of course), I though a short response was in order.
Real Climate did not like our use of a proposed correction suggested by He Who Will Not Be Named. So Real Climate proposed another correction based on a graphic printed in The Independent. Never mind that the correction doesn’t seem to jibe with that proposed by Thompson et al., but no matter, we used the one suggested by Mr. Not-To-Be-Named so lets use Real Climate’s as well and see what difference it makes to temperature trends since 1950. Based on what Real Climate asserts (but oddly does not show with numbers), you’d think that their proposed adjustment results in absolutely no change to mid-20th century trends, and indeed anyone suggesting otherwise is an idiot or of ill-will. We’ll lets see what the numbers show.
The graph below shows a first guess at the effects of the Real Climate adjustments (based on a decreasing adjustment from 1950-60) based on the graphic in The Independent.
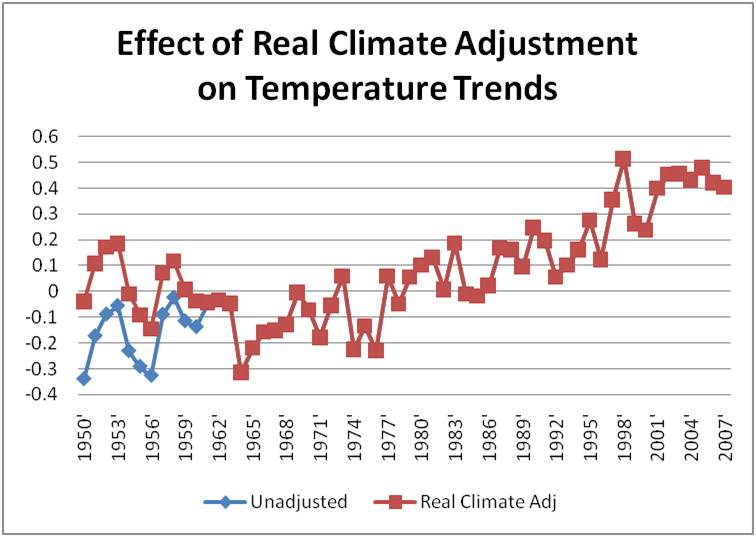
What difference to trends since 1950 does it make? Instead of the about 50% reduction in the 1950-2007 trend from the first rough guess from you-know-who, Real Climate’s first guess results in a reduction of the trend by about 30%. A 30% reduction in the IPCC’s estimate in temperature trends since 1950 would be just as important as a 50% reduction, and questions of its significance would seem appropriate to ask. But perhaps a 30% reduction in the trend would be viewed as being “consistent with” the original trend ![]()
Try again Real Climate. And next time, his name is STEVE MCINTYRE — and his blog is called CLIMATE AUDIT. There is a lot of science and civil discussion there, with a healthy mix of assorted experts and a range of ordinary folks. Questioning scientific conclusions is a lot healthier for science than rote defense, but we all learned that in grad school, didn’t we?
June 1st, 2008 at 7:26 pm
Yes. I should think a 30% reduction in the trend since 1950 would affect the estimate of the climate sensitivity and the estimate of the mean trend since 1950. A 50% reduction would have a greater effect. But if it’s 30% its 30%. Presumably, those who work on these things will sort this all out.
Meanwhile, yes, people will speculate and give their opinions on the soundness of the arguments. That’s the way the world has worked since long before gavin was born and he’s just going to have to get used to it.
I’m rather puzzled by some of Gavin’s laments. The Nature article, quoting the authors of the article who suggested
a) this data quality issue was widely overlooked by climate scientists and
b) the revisions the GMST resulting from future corrections would solve the mis-match many have noticed between GCM hindcast and data.
Evidently, Gavin disagrees the issue was overlooked. But somehow, he dares not criticize *Nature* or the authors of the article itself for suggesting the issue was overlooked. It is, evidently, bloggers who took the climate scientists interviewed by Nature who are, evidently, at fault for jumping to the conclusion those particular climate scientists knew what they were talking about.
Even more intriguing is this: Gavin *seems* to suggest the corrections will be so insignificant as to make little difference to the GMST. (Or at least, you were amazingly ill informed to jump to the conclusion that SST which comprises 2/3rds of the GMST might affect the GMST). Does Gavin anticiate these revisions will make little difference to GMST?
If so, does this mean the GCM model hindcasts will look as just as poor as ever?
June 1st, 2008 at 7:44 pm
Well I responded over at RC to Gavin with the following. Assuming they let my comment through, lets see what numbers he proposes, or if he finds a reason not to give numbers.
——————-
Hi Gavin-
I’d be happy to work from a proposed adjustment directly from you, rather than rely on the one proposed by Steve McIntyre or the one you point to from The Independent.
Thompson et al. write: “The new adjustments are likely to have a substantial impact on the historical record of global-mean surface temperatures through the middle part of the twentieth century.”
It is hard to see how temperatures around 1950 can change “substantially” with no effect on trends since 1950, but maybe you have a different view. Lets hear it. Give me some better numbers and I’ll use them.
June 1st, 2008 at 7:47 pm
At the moment there seems to have 2 sides to the question.
Side one: Modelers:
Jones and realclimate:
They don’t seem to want that much change in the graph and seem to suggest that post mid-60s the data doesn’t require to be adjusted.
Their view seems to be based on this claim by Thompson:
“The adjustments are unlikely to significantly affect estimates of century-long trends in global-mean temperatures, as the data before ,1940 and after the mid-1960s are not expected to require further corrections for changes from uninsulated bucket to engine room intake measurements.”
So for them bucket and water intake are one of the same starting in the mid-60s and don’t need to be adjusted and it is probably not worth it to waste time doing it since it gives them ground for their aerosol hypothesis.
Side two: “the ignorant” (which include me) (sarcasm):
Prometheus, Climate audit:
Who believe that not only the inconvenient data should be adjusted but that all data should be adjusted accordingly to the various biases between the different bucket (wooden, canvas and insulated), water intake, hull sensor and buoy system) what ever the end result is.
Personally I don’t believe that the century long trend will be much affected since the pre-1941 data are already adjusted and that the last 10-20 years which the data came prominently from the water intake.
The biggest issue is between 1945-1975-80 that which the data will need a lot of research to determine the appropriate adjustment.
I find it troubling that Jones and Realclimate don’t seem to want to adjust the data after the mid-60s. This coincide with an important reduction in the data from the US whose to my knowledge were the one using the water intake method, leaving a dominant part of the data to the UK and whatever bucket system they used at that time. This means that any correction would be important.
June 1st, 2008 at 7:59 pm
I think there is a typo error when you wrote “…what difference it makes to temperature trends since 2050.” I think it should read 1950.
The subject raises a few questions:
1. Is there any method that can change bad data into good data?
2. After adjustments are made, how big are the error bars? Shouldn’t they expand with each adjustment?
3. Can the actual measurements be tracked by date and by ship? Can members of the crew be found to determine how the measurements were really done?
June 1st, 2008 at 8:16 pm
Roger,
That’s a piss-poor “misreading” of the graph it purports to be based on. I’m sure it is a mere coincidence that your error happens to exaggerate the effect of the change, but is there any chance you could look again at CRU graphic and produce a more plausible approximation before speculating about the difference in the trends?
June 1st, 2008 at 9:00 pm
Sylvain–
I have not yet read anyone suggest this would change the century long average. I’ve read jumbled oblique prose that seemed to be trying to make it appear some unnamed bloggers somewhere in the vast blogosphere had suggested something.
Of course, who knows? Maybe some forum reader somewhere has made such a suggestion.
June 1st, 2008 at 9:08 pm
James-
Ever the diplomat I see.
As I said to Gavin, give me some numbers that you see as better values to approximate an adjustment and I’ll use them. 1945-1960 will be fine.
June 1st, 2008 at 9:09 pm
Lucia,
I should have said that I agreed that it wouldn’t change the century long trend.
I never to imply that others did.
June 1st, 2008 at 9:10 pm
Lucia,
I should have said that I agreed that it wouldn’t change the century long trend.
I never wanted to imply that others did.
June 1st, 2008 at 9:11 pm
jarhead, Sylvain-
Thanks for catching the typos, both now fixed!
June 1st, 2008 at 9:15 pm
Sylvain–
Sorry– I didn’t mean you suggested Roger suggested this would change the century trend. I was thinking of tone at a few other blogs I’ve read. Sorry for my lack of clarity.
June 1st, 2008 at 9:40 pm
“As I said to Gavin, give me some numbers that you see as better values to approximate an adjustment and I’ll use them.”
You mean you intend to leave this obviously wrong post up uncorrected, until and unless someone else does your homework for you?
(shrug)
It’s your blog.
James
June 1st, 2008 at 9:50 pm
James-
I don’t see it as “obviously wrong” — but it certainly is not be the final word, it is just my guess at how the 5-year trend presented in The Independent might be related to annual values. Obviously, there are other opinions, and I’ve asked for yours.
Since I have asked you for your input in “correcting” my post, it now seems odd that you would dodge that invitation. How about if I do the homework and you simply chose?
A. Would you like the adjusted values in the graph cut by 1/3? If so then the change in 1950 trend from the IPCC is about 25%
B. Would you like the values cut by 50%? If so then the change in 1950 trend from the IPCC is about 20%
C. Would you like the values cut by 100%? If so then there will be no change from the IPCC.
I see that it is easy to criticize, but a little more difficult to provide a number when asked.
June 2nd, 2008 at 3:33 am
Roger
I’ll give some help:
for the Independent graph you are talking about 5-year running means, not trends, aren’t you? (what trends do you mean?).
The maximum correction of the running means (in about 1951) is about 0.15K. In your graph you start with a difference of 0.3K, which is obviously about twice of what is in the Independent graph, an obvious exaggeration for no reason. Can you explain this difference, please?
If you think an explanation for incidentally doubling values is not necessary, for a first step take half of it and add some error bars.
In a second step wait for more elaborated values.
June 2nd, 2008 at 6:01 am
# jarhead , June 1, 2008 07:59 PM3. Can the actual measurements be tracked by date and by ship? Can members of the crew be found to determine how the measurements were really done? #
Since the 1920s one was aware that reported SST measurements had their limits, and tried to improve it. Nevertheless, it will be impossible to determine a reasonable adjustment. Most data have been compiled from ship logs, which usually recorded the engine intake. Concerning bucket measurements, taken to report them immediately to the weather services, the crews had been instructed about precautionary measures, but they were not trained for that. Moreover, when the folk from the weather service regarded a reported value as >incompatible> they through the data out; but lets assume it did not happened to often .
# Roger Pielke, Jr. , June 1, 2008 09:08 PM . As I said to Gavin, give me some numbers that you see as better values to approximate an adjustment and I’ll use them. 1945-1960 will be fine.#
When it was not possible to establish a reliable correction figure in the 1960s, how shall it be possible toady? J.T.T. Saur, 1963, A Study of the Quality of Sea Water Temperatures Records in Logs of Ships Weather Observations, Journal of Applied Meteorology, p. 417-425 wrote:
QUOTE:
__The between-ship variance of bias, i.e., the inconsistency of ship bias, could well be caused by the variations from ship tp ship….
__Some special observations made abroad five U.S. Coast Guard Weather Ships have demonstrated some of the problems encountered with injection temperatures. …..Temperature errors from the five thermometers ranged from minus 2.0 F to 3.9 F.
UNQUOTE
How to establish and recommend an adjustment for the time period from 1945 –1960?.
June 2nd, 2008 at 6:10 am
CORRECTION: bern June 2, 2008 06:01 AM:
…..Temperature errors from the five thermometers ranged from minus 2.0 F to plus 3.9 F.
June 2nd, 2008 at 6:28 am
Urs-
Thanks for your comments, but The Independent graph is in error. It does not show a 5-year average, it shows a smoothing from a 21-point filter.
The period of trends that I am comparing are 1950 to 2007, as this was the period used by the IPCC in its AR4 report.
Adding error bars is a good idea (here and elsewhere)!
June 2nd, 2008 at 9:49 am
Roger,
So what did you mean with 5 year trends presented in the Independent graph?
June 2nd, 2008 at 10:17 am
Urs-
I have explored the Independent graph in a bit more depth here:
http://sciencepolicy.colorado.edu/prometheus/archives/climate_change/001447visually_pleasing_te.html
June 2nd, 2008 at 10:19 am
I am somewhat concern by this comment from Gavin Schmidt:
“Whatever they come up with will be a considered and reasonable approach that will include the buoy and drifter issues as well as the post WW-II canvas bucket transition. Second guessing how that will work out in the absence of any actual knowledge would be foolish.”
After it took them 30 years to realize that something was wrong or what was wrong with their SST’s data, we should wait upon their “expertise” to tell us the impact of what they discovered.
It is more then time that Jones release is methodology and data be maid available so that his “expertise” could get audited.
June 2nd, 2008 at 5:03 pm
This
> it took them 30 years
is wrong.
Google, you will find plenty of mentions of the known problems.
What’s new is that someone did the hard work of finding and studying the numbers and publishing the article. Lots of people have talked about it at length.
One off the first page of hits for
ocean temperature bucket intake
http://www.cmos.ca/Ao/Abstracts/v160301.pdf
On The Accuracy of Sea-Surface Temperatures and Salinities Observed in the Northeast Pacific Ocean
S. Tabata, Institute of Ocean Sciences, Sidney, B.C., Canada
[Original manuscript received 8 June 1977;
in revised form 30 December 1977]
June 2nd, 2008 at 7:47 pm
“Google, you will find plenty of mentions of the known problems.”
It has 25-30 years that Jones is responsible for the UK version of the temp graph. He always have refused to share his data source and code. Yet he and his team only discovered the origin of the problem with the data recently even though there was several mention of problem with SST’s data.
Who knows what other problem could be found if it was available for auditing. Biases for land data are just has numerous and problematic.
June 3rd, 2008 at 3:43 pm
I have a stupid question, but if I knew the answer I wouldn’t be asking it?
Realclimate presented this graph:
I do they achieve the 0.1 C difference between the bucket and the inlet while most of the graph shows a difference bigger than the 0.1 C.
June 3rd, 2008 at 3:44 pm
link to the graph:
http://www.realclimate.org/images/buckets_diff.jpg
June 15th, 2008 at 10:16 am
Kinda funny.
When RC posted this, I thanked them for crediting
Steve McIntyre. the post of course didnt make it through. sarcasm filter must have been on.
It’s odd, they lend more credibility to their opposition by refusing to engage, than by actually engaging.
Imagine a world where you believe that you should talk to Iran, but should not talk to mining guy from canada. weird.