The Helpful Undergraduate: Another Response to James Annan
May 16th, 2008Posted by: Roger Pielke, Jr.
In his latest essay on my stupidity, climate modeler James Annan made the helpful suggestion that I consult a “a numerate undergraduate to explain it to [me].” So I looked outside my office, where things are quiet out on the quad this time of year, but as luck would have it, I did find a young lady named Megan, who just happened to be majoring in mathematics who agreed to help me overcome my considerable ignorance.
The first thing I had to do was explain to Megan the problem we are looking at. I told her that we had 55 estimates of a particular quantity, with a mean of 0.19 and standard deviation of 0.21. At the same time we had 5 different observations of that same quantity, with a mean of –0.07 and standard deviation of 0.07. I wanted to know how similar or different from each other these two sets of data actually were.
I explained to her that James Annan, a modest, constructive, and respectful colleague of mine who happened to be a climate modeler (“Cool” she said), had explained that the best way to compare these datasets was to look at the normal distribution associated with the data (N(0.19. 0.21) and plot on that distribution the outlying value from the smaller dataset.
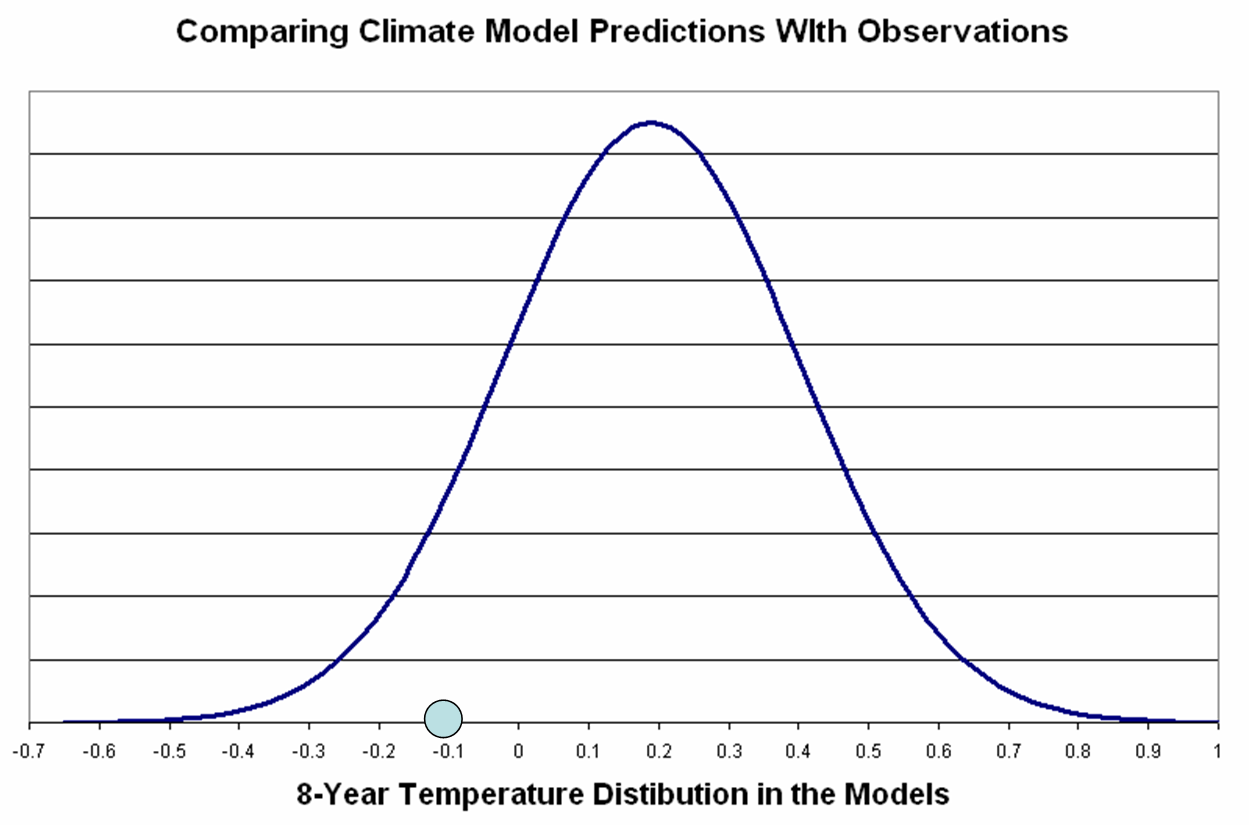
Since the outlying value of the observations fell well within the distribution of the estimates, James told us, the two dataset could not be claimed to be different — case closed, anyone saying anything different must be an ignorant climate denying lunatic.
“Professor Pielke,” Megan said, “You are funny. James surely didn’t react that way, because since he is a climate modeler he must surely recognize that there are many ways to look at statistical problems. We even learned that just this year in our intro stats class. Besides, I can’t imagine a scientific colleague being so rude! You must have misinterpreted him.”
Since Megan was being so helpful in my education, I simply replied that we should stick to the stats. Besides, if she really knew that I was a climate denying moron, she might not continue to help me.
Megan said, “There is another way to approach this problem. Have you heard of an unpaired t-test for two different samples? (PDF)”
I replied, “Of course not, I am just a political scientist.”
Megan said, “We learned in stats this year that such a test is appropriate for comparing two distributions with equal variance to see how similar they are. It is really very easy. In fact you can run these tests online using a simple calculator. Here is one such website that will do all of the work for you, just plug in the numbers.”
So we plugged our numbers into the magic website as follows:
Sample 1:
Mean = 0.19
SD = 0.21
N = 55
Sample 2
Mean = -0.07
SD = 0.07
N = 5
And here is what the magic website reported back:
Unpaired t test results
P value and statistical significance:
The two-tailed P value equals 0.0082
By conventional criteria, this difference is considered to be very statistically significant.
Confidence interval:
The mean of Group One minus Group Two equals -0.2600
95% confidence interval of this difference: From -0.4502 to -0.0698Intermediate values used in calculations:
t = 2.7358
df = 58
standard error of difference = 0.095
“Wow,” I said to Megan, “These are lots of numbers. What do they all mean?”
“Well,” Megan helpfully replied, “They mean that there is a really good chance that your two distributions are inconsistent with each other.”
“But,” I protested, “Climate modeler James Annan came up with a different result! And he said that his method was the one true way!”
“You are kidding me again, Professor Pielke,” she calmly replied, “Dr. Annan surely recognizes that there are a lot of interesting nuances in statistical testing and using and working with information. There are even issues that can be raised about the appropriateness of test that we performed. So I wouldn’t even be too assured that these results are the one true way either. But they do indicate that there are different ways to approach scientific questions. I am sure that Dr. Annan recognizes this, after all he is a climate scientist. But we’ll have to discuss those nuances later. I’m taking philosophy of science in the fall, and would be glad to tutor you in that subject as well. But for now I have to run, I am on summer break after all.”
And just like that she was gone. Well, after this experience I am just happy that I was instructed to find a smart undergraduate to help me out.
[UPDATE An alert reader notes this comment by Tom C over at James' blog, which is right on the mark:
James -
What you and Roger are arguing about is not worth arguing about. What is worth arguing about is the philosophy behind comparing real-world data to model predictions. I work in the chemical industry. If my boss asked me to model a process, I would not come back with an ensemble of models, some of which predict an increase in a byproduct, some of which predict a decrease, and then claim that the observed concentration of byproduct was "consistent with models". That is just bizarre reasoning, but, of course, such a strategy allows for perpetual CYAing.
The fallacy here is that you are taking models, which are inherently different from one another, pretending that they are multiple measurements of a variable that differ only due to random fluctuations, then doing conventional statistics on the "distribution". This is all conceptually flawed.
Moreover, the wider the divergence of model results, the better the chance of "consistency" with real-world observations. That fact alone should signal the conceptual problem with the approach assumed in your argument with Roger.
Another commenter tries to help out James by responding to Tom C, but in the process, also hits the nail on the head:
I don't see what the problem is, Tom C. It seems obvious that the less specific a set of predictions is, the more difficult it is to invalidate. So yes, consistency doesn't neccessarily mean that your model is meaningful, especially over such short terms.
Right! "Consistent with" is not a meaningful statement. Which is of course where all of this started.
[UPDATE #2]
The figure below shows the IPCC distribution of 55 forecasts N[0.19, 0.21] as the blue curve, and I have invented a new distribution (red curve) by adding a bunch of hypothetical nonsense forecasts such that the distribution is now N[0.19, 1.0].
The blue point represents a hypothetical observation.
According to the metric of evaluating forecasts and observations proposed by James Annan my forecasting ability improved immensely simply by adding 55 nonsense forecasts, since th blue observational point now falls closer to the center of the new (and improved distribution).
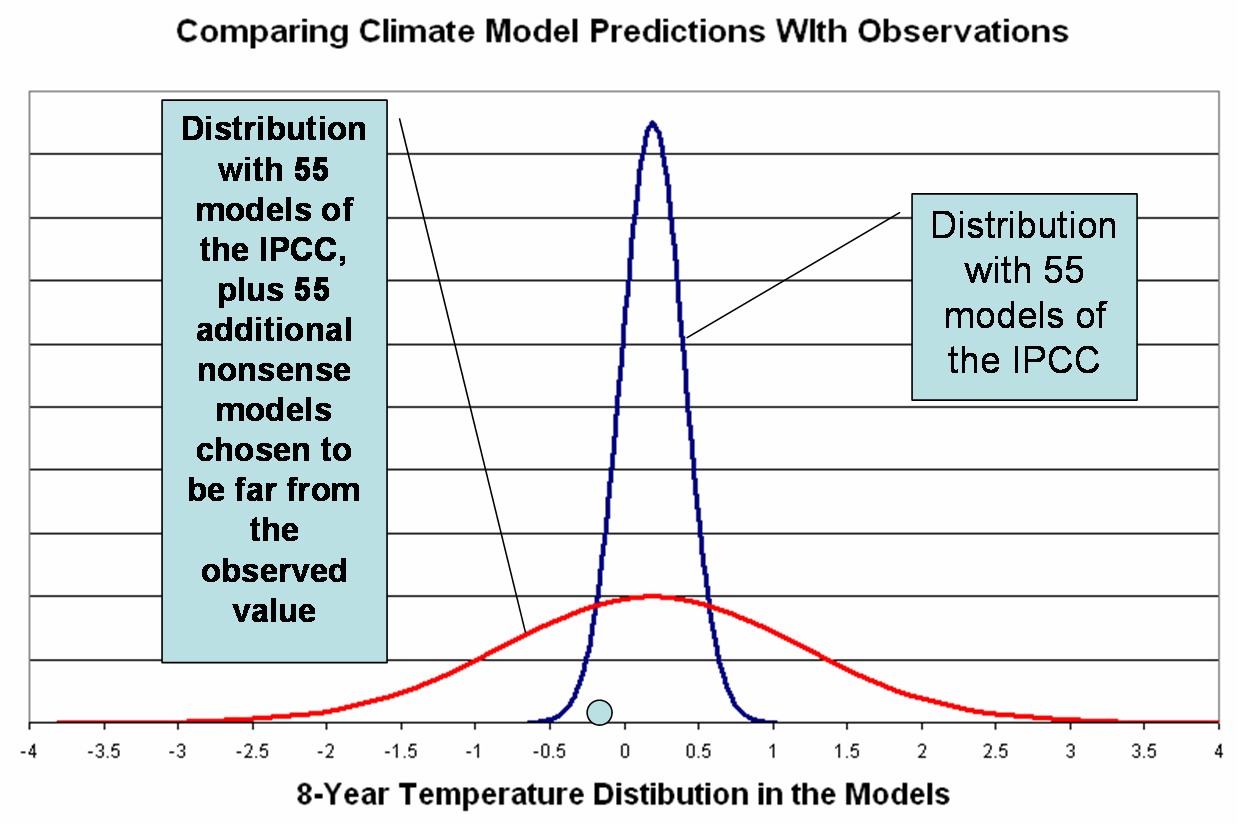
Now if James wants to call this an improvement (“more consistent whit” — “higher statistical significance” — etc.], but any approach that lends greater consistency by making adding worse forecasts to your distributions fails the common sense test.
[UPDATE #3]
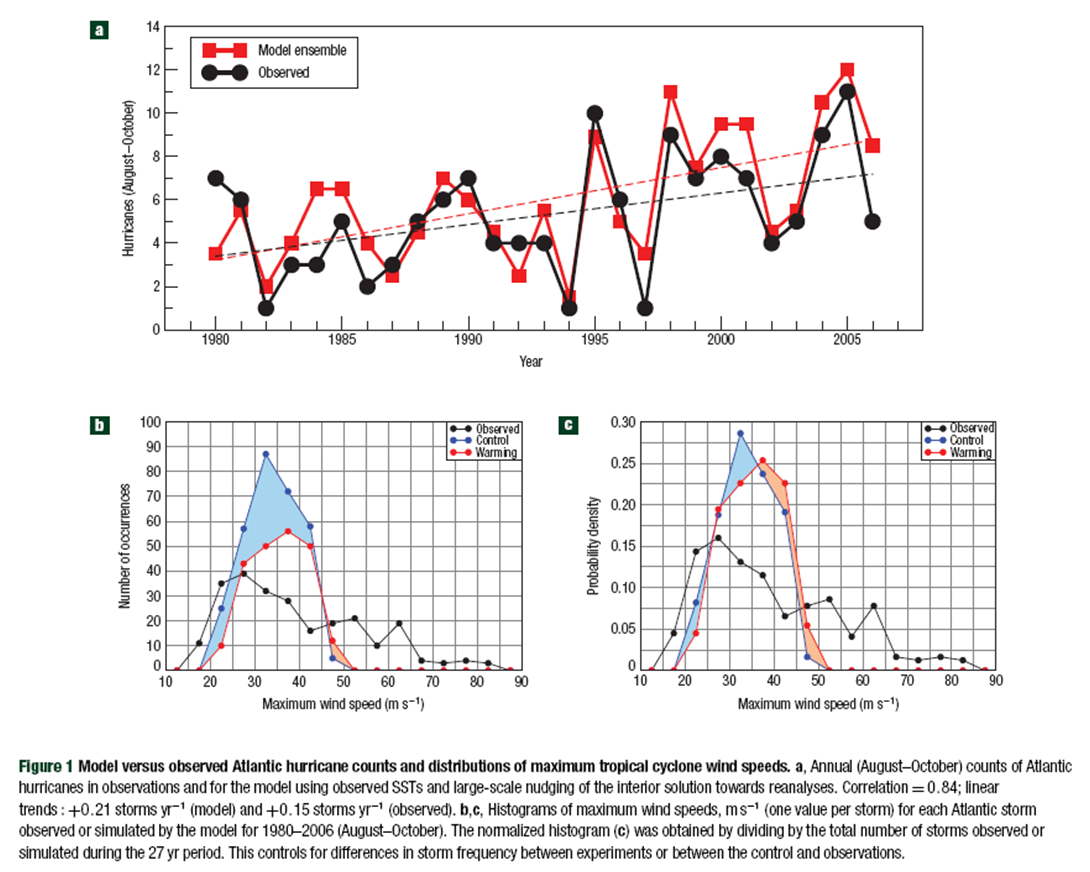
Real Climate says this about a model-observation comparison in a recent paper by Knutson et al. in Nature Geoscience on hurricanes:
The fact that the RCM-based downscaling approach can reproduce the observed changes when fed modern reanalysis data is used by Knutson et al as a ‘validation’ of the modeling approach (in a very rough sense of the word–there is in fact a non-trivial 40% discrepancy in the modeled and observed trends in TC frequency). But this does not indicate that the downscaled GCM projections will provide a realistic description of future TCs in combination with a multi-model GCM ensemble mean. It only tells us that the RCM can potentially provide a realistic description of TC behavior provided the correct input.
Have a look at the figure below, and the distributions of modeled and observations. Its funny how the differences in these distributions is considered to be “non-trivial” but the larger differences in temperature trends is “not inconsistent with” model predictions. Further proof of the irrelevance of the notion of “consistency.”
May 16th, 2008 at 2:52 pm
As Megan says, the t test is for two distributions of equal variance. Of course it seems like here we are comparing observations to predictions. I am not enough of an expert on how the observations or predictions are conducted to know what their variances might be- but since we understand the factors and dynamics in our models and we don’t understand the factors and dynamics driving our observations, it seems likely that the variances of predictions and observations are not the same.
I would suspect there are experts in “the statistics of comparing model outputs and their averages to observations” who could offer a great deal to this debate. If there aren’t, seems like there should be!
May 16th, 2008 at 3:18 pm
dopine- Thanks. The simple answer is if the models do not recreate the variability of temperature trends observed in the real world, then they have far deeper problems than prediction-observations consistency!
May 16th, 2008 at 3:46 pm
In this instance you would not expect the variance of the models to match the variance of the observations. Why? Because they do not represent the same thing:
The model runs are 55 independent realizations of weather. The observations are 5 measurements of a single weather realization. The modelling equivalent would be “measuring” the model temperature in different ways.
May 16th, 2008 at 3:53 pm
The phrase ‘consistent with observations’ should imply that there is a use to the consistency and not only an otherwise meaningless statistical match at some level, should it not?
Claiming ‘no case’ and then being shown a case 2001 to now. Is that not really ‘no case involving proper time periods the model can handle’ is really it? Saying a model only good for x time period is invalid to test for x< but why not say it?
May 16th, 2008 at 3:55 pm
John V-
They do (or are supposed to) represent the ***exact*** same thing — 8-years trends in global average temperatures.
Remember both James and RC defined the observed trend to be equivalent to a “realization” from the models.
May 16th, 2008 at 4:03 pm
Roger,
It’s an important statistical subtlety, but the two sets of trend estimates should not be expected to have the same variance.
If we were comparing the heights of Swedish men (per lucia’s analog), this would be the difference:
The 5 observations are 5 measurements of *one* Swedish man’s height. The 55 models are single measurements of each of 55 different Swedish men. Both sets of data attempt to determine the average height of Swedish men. The variance is not the same.
May 16th, 2008 at 5:36 pm
John V-
You have provided a great example of how this discussion arrives squarely in the realm of the philosophy of science. Lucia’s analogy is a good and useful one, but not the only one/
Each climate model purports to reflect the real world. So each model might be interpreted as a model of your single Swedish man. The observations are measurements of the same man. Variance is the same.
The difference? How one frames the problem. Ultimately, a key question here is how to interpret a climate model realization. It is worth discussing, and I’ll openly admit uncertainty on this question.
But, one this is clear to me, there is enough play in the assumptions to allow for all sorts of cherrypicking of assumptions (no different than cherrypicking of start and end dates in a regression!) to arrive at a particular result.
Thanks.
May 16th, 2008 at 5:48 pm
Cheerleader and former Real Climate contributor William Connolley says that it is just not fair to be comparing observations to models:
http://scienceblogs.com/stoat/2008/05/losing_the_plot.php
“You can’t compare the trends from different model realisations with 5 different estimates of the same observational period. To try to understand this, suppose all 5 obs estimates were really really close together – they could be, if all the methods were near equivalent. Then the SD would be very small. But the models, because they aren’t simulating the same real years, will maintain a large spread.”
Um, OK. Let suppose that all of the observations were close together, but also far from the model mean. This would mean that the REAL WORLD is showing something inconsistent with the models. I know that this situation is viewed as inconceivable among some of the modelers, but really, what is the point complaining about what the observations show? They show what they show.
Also, his claim that the models don’t simulate the same “real years” is contradicted by his colleagues at RC, see the X axis in the following figure:
http://www.realclimate.org/images/runs.jpg
You can’t make this stuff up.
May 16th, 2008 at 7:17 pm
I’m confused. When Hansen and others argue that the models are too conversative and that we have a 450ppm tipping point coming, I’m curious why their skepticism WRT to IPCC passes muster. While, on the other hand when people, such as lucia, argue that the IPCC has been a bit on on the high side, this view is taken as rank denialism. Odd.
I observe.
May 16th, 2008 at 8:38 pm
Let me add my 2 cents to this ever more opaque debate. (Remember we were warned by Matt Briggs that a sure sign of models coming apart would be more obscure, opaque, and baseless defenses.)
Statistical uncertainty tests such as the t-test make the assumption that both sets of measurements are trying to measure the same thing. Then, fluctuations in the measured values can be treated as noise. Let’s give the 5 measurement data sets the benefit of the doubt and assume that they are all trying to measure the same thing — global average temperature — and that variations in the results are random, as they arise from different sampling techniques, coverages, etc. However, it is hard to make that argument for models. Models give different results because they model climate differently, with different assumptions about how to parameterize phenomena that are not computed from first principles, etc. These differences are not the result of random noise in the modeling; they are deterministic differences resulting from deliberate choices. Therefore you can make an argument that statements such as “THE MODELS are too high, too low, consistent, inconsistent,.. whatever” based on a mean and variance are no more meaningful than a statement about the mean and variance of Newtonian, general relativity, and other theories of gravity. Rather it makes more sense to compare models one at a time and distinguish between those that come closer to the data sets and those that lie further away. That is, there are ‘better’ models and ‘worse’ models. And when you do this, you are apt to find that those models that produce a lower climate sensitivity for greenhouse gasses and project larger effects from natural phenomena such as ocean cycles cycles are the “better models.”
One of the dreadful aspects of IPCC reports on climate model projections is the focus on “central tendency.” This is a signal that in the absence of any theory of error or accuracy of the models, the only thing left to do is average them. You will even find in AR4 the bragging statement (page 13 Summary) that “the new assessment of likely ranges relies on larger numbers of models of increasing complexity.” This is what passes for science.
May 16th, 2008 at 8:39 pm
Let me add my 2 cents to this ever more opaque debate. (Remember we were warned by Matt Briggs that a sure sign of models coming apart would be more obscure, opaque, and baseless defenses.)
Statistical uncertainty tests such as the t-test make the assumption that both sets of measurements are trying to measure the same thing. Then, fluctuations in the measured values can be treated as noise. Let’s give the 5 measurement data sets the benefit of the doubt and assume that they are all trying to measure the same thing — global average temperature — and that variations in the results are random, as they arise from different sampling techniques, coverages, etc. However, it is hard to make that argument for models. Models give different results because they model climate differently, with different assumptions about how to parameterize phenomena that are not computed from first principles, etc. These differences are not the result of random noise in the modeling; they are deterministic differences resulting from deliberate choices. Therefore you can make an argument that statements such as “THE MODELS are too high, too low, consistent, inconsistent,.. whatever” based on a mean and variance are no more meaningful than a statement about the mean and variance of Newtonian, general relativity, and other theories of gravity. Rather it makes more sense to compare models one at a time and distinguish between those that come closer to the data sets and those that lie further away. That is, there are ‘better’ models and ‘worse’ models. And when you do this, you are apt to find that those models that produce a lower climate sensitivity for greenhouse gasses and project larger effects from natural phenomena such as ocean cycles cycles are the “better models.”
One of the dreadful aspects of IPCC reports on climate model projections is the focus on “central tendency.” This is a signal that in the absence of any theory of error or accuracy of the models, the only thing left to do is average them. You will even find in AR4 the bragging statement (page 13 Summary) that “the new assessment of likely ranges relies on larger numbers of models of increasing complexity.” This is what passes for science.
May 16th, 2008 at 8:53 pm
Sorry to ask but isn’t unfair to the model to compare them to real observation?
After all there projection are based on guesses about the real growth of atmospheric greenhouse gases and natural phenomenon like sun activities el-nino or la nina or the reversal of PDO.
Shouldn’t it be better that each model be re-run after 8 to 10 years period with the observed changes in atmospheric content and the proper account of natural variation.
Since I’m a bit cynic about climate science and doesn’t believe that climate scientist are neither more honest or dishonest than any other field. These verifications should be made by an independent group who has nothing to do with the IPCC process.
May 16th, 2008 at 11:36 pm
Roger,
In your two posts immediately after my post above, I believe I see a problem in your understanding of climate models.
There is a well-known limitation that the models can not predict the timing of natural cycles such as ENSO, AMO, and NAO. Therefore, multiple runs of a single model will give different trends for 2001-2008 because they have different timings for these cycles.
The implications are that:
a) Each model run has a different weather realization;
b) Model runs of the same calendar years are not modelling the same weather;
c) The 55 models run are not simulating the same weather realization (or measuring the height of a single Swedish man);
d) Multiple model runs for a single 7-year period is somewhat equivalent to observations of multiple independent 7-year periods (eg. 2001-2008, 1993-2000, 1985-1992, etc);
e) In IPCC AR4 model ensembles are used to average-out the effect of these short-term cycles (weather is explicitly removed);
I hope this clears up why the variance is different for the 5 observations vs the 55 model runs. William Connolley’s comments may also make more sense in this context.
–
steven mosher:
Are you seriously suggesting that statements from Hansen and others are given a free ride? There are many sites dedicated to auditing every detail of mainstream climate science.
The issue here and elsewhere is not with questioning IPCC results. The issue is making bold pronouncements based on bad science and/or statistics. Bad science should always be called out and challenged.
May 17th, 2008 at 6:18 am
JohnV and Jon:
“The issue is making bold pronouncements based on bad science and/or statistics. Bad science should always be called out and challenged.” Or for that matter blindly supporting “bad science or statistics.”
Amen Brother! Amen.
But, when it is turned into a religious-like political movement it no longer remains science but a fundamental belief structure. As we have today!
May 17th, 2008 at 6:59 am
steven,
Roger’s supposed “cheerleader” William Connnolley criticizes Hansen quite a bit, so I’m not sure what you’re on about here.
May 17th, 2008 at 7:55 am
John V:
“The model runs are 55 independent realizations of weather.”
I’ve said this before, and I’ll say this again. It doesn’t make sense to talk about “independent models”, if by “independent” you’re referring to the statistical sense Pr(A, B) = Pr(A)Pr(B).
Two models modelling the same phenomenon can’t be independent: they’re either the same, or they’re mutually exclusive.
Given two models of a coin flip, say A and B, where the models are defined by the parameters
Pr(H | A) = probability of heads under model A,
Pr(T | A) = probability of tails under model A = 1 – Pr(H | A),
Pr(H | B) = probability of heads under model B,
Pr(T | B) = probability of tails under model B = 1 – Pr(H | B),
then either A and B are both identical, i.e. Pr(H | A) = Pr(H | B) and Pr(T | A) = Pr(T | B); or A and B are mutually exclusive, e.g. A says the coin’s biased, and B says the coin’s unbiased. A coin can’t be both biased and unbiased at the same time.
The way to deal with an ensemble of models is to combine then into a mixture model, then simply evaluate probabilities under this mixture model (which’ll obviate the need for a separate t-test, by the way).
(For the coin flip, it’ll be like saying “there’s a 40% probability (given our state of knowledge) that the coin’s biased in such and such a way, and a 60% probability that the coin’s unbiased”.)
In any case, the analysis will be different from (erroneously) treating the models as “independent observations”, which is what Pielke’s doing.
May 17th, 2008 at 10:49 am
John V-
You write:
“Therefore, multiple runs of a single model will give different trends for 2001-2008 because they have different timings for these cycles.”
Of course, this is why any large set of model realizations will have a much larger spread than observations. But this also means that the models should encompass a very wide range of possible observations (this point was made by RC).
So when observations don’t square well with the model spread, that is an interesting result.
Frank Bi-
I am following RC’s lead in treating the models as independent realizations, subject to approximation via a normal distribution. Like you, I think that this practice is flawed. Perhaps you have already made this comment over at RC.
May 17th, 2008 at 11:30 am
John V, Frank, others-
Let me make this as simple as possible.
Lets say I have a class of 60 students. There assignment is to predict the trend in streamflow in Boulder Creek over the next 8 days.
I divide the class into two groups one of 55 students, the other of 5 students.
From the 55 I explain that they need to come up with one prediction per student, and they can work in teams or independently, I don’t care. What will result is 55 forecasts of the streamflow trend over the next 8 days.
For the 5 I have asked them to each measure the rise in streamflow over the next 8 days. They can use whatever method they want, and I point them to a remote sensing dataset and a series of USGS streamflow gauges that might be useful.
The 55 come back with a distribution of forecasted trends and the 5 come back with a distribution of observed trends.
We can then compare how well the 55 forecasters actual did.
If they data was as presented in this post, I’d say that the forecasters did pretty bad.
If they protested with comments about “streamflow noise” or “single observations within model spread” I’d reduce their grade even further;-)
May 17th, 2008 at 12:39 pm
If they protested with comments about “streamflow noise” or “single observations within model spread” I’d reduce their grade even further;-)
Then pity the poor stream forecaster in places like Arizona where flash floods are 1) frequent 2) impossible to predict with certainty 3) are capable of changing streamflow by orders of magnitude
The fact that one can’t forecast individual flash floods with precision doesn’t mean we are unable to make any long-term predictions regarding them.
Nor does it say that streamflow models are useless.
May 17th, 2008 at 12:52 pm
dhogaza-
You state: “The fact that one can’t forecast individual flash floods with precision doesn’t mean we are unable to make any long-term predictions regarding them.”
Sure, and I agree. But we are talking about predicting trends here, and not individual floods. So the point is not quite on target.
But even so, a flash flood is like an ENSO event. And forecasters are probably better at predicting a frequency of ENSO events over a particular period, rather than the onset of a particular event.
But whether ENSO or flash floods, the possibility of such events in the time frame of interest should be reflected in the distribution of forecasted trends.
If climate forecasts don’t consider ENSO, or streamflow forecasts don’t consider flash floods, then we should expect a fairly high probability of inconsistency between models and observations on time scales that flash floods and ENSO occurs. If you were to say, “sure the obs and models are inconsistent, but this is because he models are incomplete” I’d probably have some sympathy for this view. But this is not the argument made by James Annan. He has argued that the obs and predictions are in fact consistent.
Aside: If you want to see an analysis of the role of forecasts/uncertainty in a specific flood event with aspects similar to this discussion see:
Pielke, Jr., R.A., 1999: Who Decides? Forecasts and Responsibilities in the 1997 Red River Flood. American Behavioral Science Review 7, 2, 83-101.
http://sciencepolicy.colorado.edu/admin/publication_files/resource-81-1999.16.pdf
May 17th, 2008 at 1:01 pm
Roger, Frank,
Small technical point: if the observations in either of the samples are not independent, one can still make a two-sample, comparison of means test. The problem with the test is the t-statistic that is computed for the test no longer has a student’s distribution. For example suppose one sample were taken from a sequence of autocorrelated variables. Then, even if the underlying variates were normally distributed, the sample variance isn’t a Chi-Square and, for positive autocorrelation, an underestimate of the variance of the observations. But of course, this is just a question of where to place the critical region point of rejection, not a statement that the test is invalid conceptually.
John V.,
Suppose for a second that the models have everything right but the timing of the cycles and for the period of testing the timing of the cycles has effects larger than the difference between the two sample means (per the two sample, observations-versus-climate-model-predictions test). And further for the sample of observations we have, we have rejected the null hypothesis that the climate model projections have the same mean as the observations. That rejection is still valid for the period of the observations. If over some longer period it is a characteristic of the models that the timing of the cycles no longer matters, then that can only be tested over that longer period. However, in the absence of such a test, we have no empirical reason to accept the statement that the model predictions have the same mean (viewed as a scale trend slope of vector of individual levels) as the model, a.k.a. the measured real world, which generated the observations.
May 17th, 2008 at 3:39 pm
Roger’s analogy shows that he understands the falsification of the “Megan” analysis, and he should say as much.
Regarding James’ point, the analogy misses the point. Suppose you asked your 55 students to guess the seasonal trend in stream flow, while you asked the remaining 5 to measure the observed trend over a week. Then suppose you used the observed trend to verify the predicted trend.
Your students might well object that their confidence in the trend over 12 weeks is much stronger than their confidence over a week. In the one case climatology is detectable, while in the other, individual events overwhelm the trend. Thus, while their efforts may have very little utility in predicting over the course of a week, that was not what you asked them to do in the first place!
The inability of models to predict high frequency variations does not preclude the model’s ability to produce results about lower frequencies, just as its weakness in very local climatologies doesn’t necessarily reflect in its accuracy at continental scale.
More to the point, the models are not falsified by doing a “poor job”; the models theselves tell you that they are expected to do a poor job on the time scale they do not resolve. That is not a falsification.
Falsification would occur if the model result fell out of the model uncertainty window. This is much easier on longer time scales where the models make predictions substantially different from unforced climatology, than on short time scales where the natural variability dominates.
Here’s a picture:
http://maps.grida.no/go/graphic/projected-temperatures-in-the-21th-century
I expect that mathematical subtleties aside, it should be easy to understand that GCMs are making very weak assertions on shorter time scales and therefore are unlikely to be proven wrong on those scales. Indeed, only an abrupt change in climate could falsify the models, whose short-term prediction is for stability in all extant cases.
May 17th, 2008 at 4:19 pm
Michael-
Thanks very much for your comments. A few replies . . .
1. Please have a look at this graph from RC:
http://www.realclimate.org/images/trends_dist.jpg
The model forecasts are clearly labeled in terms of a specific 8 years 2000-2007.
This then is the prediction of trends over this period from these models. It just so happens that these models were generated in order to predict much longer term trends. In the streamflow analogy, it would be as if my 55 students decided to use a seasonal streamflow model to generate their 8-year trend prediction.
The conclusion however that the 8 year obs and forecasts are significantly different still stands.
Now if you were to say “Well these models aren’t supposed to predict anything well on 8-year time frames” (and it sounds like this is what you may be saying), then I would probably agree with you. But this is not what Annan and RC are saying. They are saying that the short term (8 years) predictions are well matched (“consistent with” — statistically indistinguishable from — etc) with the obs. This is a different point.
2. You state “the models are not falsified by doing a “poor job”"
I agree!
I have consistently talked about falsifying predictions, and not models. Whether people issuing the predictions want to explore why it is that their predictions on short time scales are inconsistent with observations is their business. But they should realize that people are paying attention, and claims that 8-year obs are “consistent with” 8-year forecasts are either substantively empty (if “consistent with is defined, in your words, as anything and everything except “abrupt climate change”) or wrong if defined in conventional statistical terminology of forecast verification.
If the long term forecasts from climate models are correct, then at some point the observations should evolve from being inconsistent to consistent with the forecasts as time goes forward. I’m interested in knowing when that time period is so that I know when the concept of “inconsistent with” has some actual meaning.
Thanks!
May 17th, 2008 at 8:58 pm
Let’s assume for a moment that mid 20th century aerosols had little impact on global temperatures. This is a valid assumption because these aerosols were mainly confined to the Northern Hemisphere, yet the planet cooled in both hemispheres at the same time, indicating that the cause of the cooling was not confined to half of the planet. There are many other reasons to assume a weak tropospheric aerosol/temperature connection as well, including the fact that no one has ever measured such a significant effect.
If this assumption is correct, then we find that the models are inconsistent with the observations for half of the last 120 years (and most of the years before that, to the best of our very limited knowledge), and arguments about 8 or 10 year periods being too short to mean anything become mute. Ironically, we find that the model projections of warming with increasing CO2 are only ‘consistent with’ observations when the Pacific Decadal Oscillation is in its positive phase, which means they are getting the right answer for the wrong reason.
If natural variability, like multidecadal ocean cycles, is strong enough to override the warming effect of increasing CO2, then the models wrong and they are wrong all the time, even if they are sometimes consistent with observations.
May 18th, 2008 at 2:08 am
Roger:
“I am following RC’s lead in treating the models as independent realizations, subject to approximation via a normal distribution. Like you, I think that this practice is flawed.”
So is this the “Clinton did it too” defense? You’re purposely using what you admit to be a flawed methodology, and your defence is that other people are using it too, so it’s not flawed after all?
The “Clinton did it too” defence is bogus anyway. As far as I know, neither Gavin, nor Annan, nor Connolley has ever treated models as “independent realizations”. Gavin talks about “independently derived models”, but “independently derived” isn’t the same as “independent” in the probabilistic sense.
Martin:
Since the models already provide a distribution to work from, I think it’d make more sense to simply directly calculate the probability of the observations under the models!
(Or more precisely, the probability that the stochastic variables can achieve values at least as extreme as the observed values.)
Using my coin analogy, if I already have a model of the intrinsic properties of the coin (e.g. that the coin is unbiased), and I toss the coin 10 times and get 9 heads and 1 tails, then I can directly evaluate the probability (under, in this case, the binomial distribution) that 10 tosses will give me more than 9 heads.
– bi, http://frankbi.wordpress.com/
May 18th, 2008 at 5:05 am
A large part of the last 20 years of my career has been spent building, testing and auditing mathematical models for valuing financial instruments. The experience of the financial services world is useful, because models are built and tested with real world data in very short timescales compared to climate models. There is also a vast amount of experience in model validation and strong pressure to get it right. A model failure may not destroy the planet, but it can and does lose a few hundred million dollars in a few days when it happens, so the industry has put a lot of effort into model validation.
The standard approach to model validation is to back test to real data. When you do this the real data never exactly agrees with the model outputs and the normal approach is to consider whether the observed data fits the model data, using a variety of techniques. The distribution of model outputs can come from a number of sources.
1. Many models have stochastic inputs – for example they may use monte carlo simulation to generate future scenarios.
2. It is never enough just to have the predicted output it is always supplemented with sensitivities to the underlying input variables ( often called the greeks). Information about how sensitive the model is to input variables and its underlying assumptions is critical to understanding the range of outputs that are possible from a model.
An additional complication is that some models are path dependent and so need to be validated at each time point taking into the account previous actually realised paths and we well as other possible ones.
If the backtesting shows that the actual results fit within reasonable confidence limits derived from the model and it is shown to be not unduly sensitive to input variables or assumptions then maybe it is a good model. You might then allow it to be used tentatively, but in a controlled manner and with limited risk. If it does not fit or is shown to be very sensitive to assumptions then it would probably not get passed.
Applying this to the discussion, I am not clear whether the model realisations referred to in Real Climate means a running a different model with the same data or does it mean running the same model with different inputs. In either case you cannot say much about the results unless you know something about the inputs and the sensitivity of the models to assumptions and input variables.
However if a significant proportion of the observations are outside the 95% confidence level of model results then that is reason for doubt. In addition a simple statistical test such as the t test indicated that the results are different. (To be valid the t test requires certain assumptions to be true such as a normal distribution and making certain adjustments if the variances are not similar. – the variances are different and it is not clear whether Megan allowed for this).
These two observations create sufficient doubt about the model that the differences need to be reconciled and explained.
You would not see many financial firms risking their money on the model with these characteristics. This does not necessarily mean the model is wrong, but in a commercial environment it would raise enough doubts that you would not proceed without explaining the difference. Very often the process of reconciliation provides some useful additional insight. It might show the model is wrong or it may expose some additional factor that needs to be taken into account in the model.
What can you conclude? Barring an error in the statistics there is a discrepancy that should be explained. The explanation might just show that some additional factor needs to be considered in the models, which might enhance their predictive power or it may show some serious flaw in the CO2 hypothesis. What you cannot conclude is that a significant deviation from the model predictions is consistent with the models and does not require some further explanation.
May 18th, 2008 at 5:05 am
Roger,
JohnV is right. The t-test tests whether two sets of numbers are samples from the same distribution, not whether they are measuring the same thing.
To see this, try running your test again at that site. But instead of the second set of numbers you had, put in mean .15, sd=.01, N=1000. It will tell you that this is highly significantly different.
Now this seems odd. If the models say mean .19, with a spread of .21, then finding the true value is .15 would not be considered an outlier. And the fact that the predicted quantity has been repeatedly sampled and established very well to be 0.15 does not make the model prediction any worse.
What the t-test is now telling you now the other way round; the model prediction spread could not have been from the distribution of measurements. Well, of course; they have a totally different type of uncertainty. But it doesn’t mean the models predicted badly, in the light of the spread that was acknowledged in advance.
May 18th, 2008 at 5:05 am
A large part of the last 20 years of my career has been spent building, testing and auditing mathematical models for valuing financial instruments. The experience of the financial services world is useful, because models are built and tested with real world data in very short timescales compared to climate models. There is also a vast amount of experience in model validation and strong pressure to get it right. A model failure may not destroy the planet, but it can and does lose a few hundred million dollars in a few days when it happens, so the industry has put a lot of effort into model validation.
The standard approach to model validation is to back test to real data. When you do this the real data never exactly agrees with the model outputs and the normal approach is to consider whether the observed data fits the model data, using a variety of techniques. The distribution of model outputs can come from a number of sources.
1. Many models have stochastic inputs – for example they may use monte carlo simulation to generate future scenarios.
2. It is never enough just to have the predicted output it is always supplemented with sensitivities to the underlying input variables ( often called the greeks). Information about how sensitive the model is to input variables and its underlying assumptions is critical to understanding the range of outputs that are possible from a model.
An additional complication is that some models are path dependent and so need to be validated at each time point taking into the account previous actually realised paths and we well as other possible ones.
If the backtesting shows that the actual results fit within reasonable confidence limits derived from the model and it is shown to be not unduly sensitive to input variables or assumptions then maybe it is a good model. You might then allow it to be used tentatively, but in a controlled manner and with limited risk. If it does not fit or is shown to be very sensitive to assumptions then it would probably not get passed.
Applying this to the discussion, I am not clear whether the model realisations referred to in Real Climate means a running a different model with the same data or does it mean running the same model with different inputs. In either case you cannot say much about the results unless you know something about the inputs and the sensitivity of the models to assumptions and input variables.
However if a significant proportion of the observations are outside the 95% confidence level of model results then that is reason for doubt. In addition a simple statistical test such as the t test indicated that the results are different. (To be valid the t test requires certain assumptions to be true such as a normal distribution and making certain adjustments if the variances are not similar. – the variances are different and it is not clear whether Megan allowed for this).
These two observations create sufficient doubt about the model that the differences need to be reconciled and explained.
You would not see many financial firms risking their money on the model with these characteristics. This does not necessarily mean the model is wrong, but in a commercial environment it would raise enough doubts that you would not proceed without explaining the difference. Very often the process of reconciliation provides some useful additional insight. It might show the model is wrong or it may expose some additional factor that needs to be taken into account in the model.
What can you conclude? Barring an error in the statistics there is a discrepancy that should be explained. The explanation might just show that some additional factor needs to be considered in the models, which might enhance their predictive power or it may show some serious flaw in the CO2 hypothesis. What you cannot conclude is that a significant deviation from the model predictions is consistent with the models and does not require some further explanation.
May 18th, 2008 at 5:07 am
Roger,
JohnV is right. The t-test tests whether two sets of numbers are samples from the same distribution, not whether they are measuring the same thing.
To see this, try running your test again at that site. But instead of the second set of numbers you had, put in mean .15, sd=.01, N=1000. It will tell you that this is highly significantly different.
Now this seems odd. If the models say mean .19, with a spread of .21, then finding the true value is close to .15 would not be considered an outlier. And the fact that the predicted quantity has been repeatedly sampled and established very well to be 0.15 does not make the model prediction any worse.
What the t-test is now telling you now the other way round; the model prediction spread could not have been from the distribution of measurements. Well, of course; they have a totally different type of uncertainty. But it doesn’t mean the models predicted badly, in the light of the spread that was acknowledged in advance.
May 18th, 2008 at 6:15 am
Roger,
Can you answer me this?
1. In Pielke-statistics-world, what temperature trend over 2000-2007 would *you* consider to be consistent at the 95% level with the model ensemble (ie the analysis provided by Gavin @ RC)?
2. Of the 55 model integrations in that ensemble, how many of them would be consistent with the model ensemble, according to your answer to 1?
3. What is 95% of 55?
Sorry for so many questions. But they are intended to be trivial, and contain no tricks.
May 18th, 2008 at 8:17 am
Nick S-
Thanks for these comments. They are very cogent and have helped me to understand why my point of view is different than that of James Annan, or at least, helps me to hypothesize a reason for the differences in view.
There is an important distinction to be made here in the question that we are examining.
A. One is if the distribution shown at Real Climate represents a prediction for evolution of the temperature system from 2000-2007, and if so, we would ask, how well did that prediction do for that time period?
B. The other is if the RC distribution simply reflects the variability found across climate models for any generic 8-year period on planet Earth, and ask, where do the most recent 8 years fall within that distribution?
Discussion: I would apply a different test of similarities/differences to the two questions A and B.
For B it is of course important to compare whether the statistical properties of climate models match what we see in the real world. So in this case when James plots a point representing observations within the model spread and says “consistent” he is saying “Yep, our models represent a sufficiently wide range of variability to encompass the past 8 years.”
But this sort of test is tautological, since to be used in the first place the models (presumably) have to pass some tests of being able to replicate the basic statistical properties of the observed climate system.
So in your example 0.15, .1, 1000, I agree that it would make no sense to claim that the observations are inconsistent with the model spread — ***if the question is whether the models accurately represent observed variability in the climate system.
Now if you told me that the RC distribution was a prediction for the specific years 2000-2007 (e.g., as they have labeled their graphs), then I would indeed conclude that observations of 0.15, 0.1, 1000 are inconsistent with that prediction, using exactly the test applied. The prediction in this case is hopelessly overdetermined.
It is like a weather forecaster (and no I am not comparing weather and climate) predicting that tomorrow’s high temperature in Boulder will be between -32 and 106 with a mean of 58, because this is he range observed for this date for historical days. When tomorrow’s temperature is observed to be 84, the forecaster could say, “Aha, yes, the observations was consistent with my forecast” — And I’d say “What a poor and useless prediction”
Perhaps James is asking and answering whether the past 8-years falls within the spread of all possible 8-year trends presented in climate models. If so, then I have no quibble with him, but it is not an interesting question. Further, it is wrong and misleading to characterize this as a prediction for specific years (e.g., as RC has done), and it is misleading to present climate model realizations as if they are actually presenting the evolution of the earth system between the present and some future state.
If this is the case then it means that statements of “consistent with” some real-world observations and climate models are not only meaningless but willfully misleading.
I am not fully convinced of this because the IPCC not only presents actual years on its graphs (e.g., 2000, 2010, etc.) but offers up specific climate behavior for specific places on planet earth, so they do seem to be presenting things in the form of A above. I’ll mull on this as it seems worth discussing.
I’d be interested in James’ reactions if he can control his snark;-)
May 18th, 2008 at 8:28 am
“Now if you told me that the RC distribution was a prediction for the specific years 2000-2007 (e.g., as they have labeled their graphs)”
Please point to a graph at RC that is labeled “Prediction for 2000-2007″ All I see is a graph showing all model realizations.
May 18th, 2008 at 8:39 am
James-
Some replies:
1. Where there is a 95% overlap of the distributions of forecasts and observations, calculated using the overlapping coefficient. This is a test I have not applied, so perhaps I will this week. Eyeballing my figures from the earlier post I’d guess its something like a range from -0.05 to 0.45.
2. You haven’t defined “consistent with” so I’ll give you 2 answers.
A. If you mean how many of 55 realizations fall within the range of the 55 realizations, then the answer is 55. This is the tautological point I raised in my previous comment.
B. If you mean how many realizations fall within the 95% range of the models then this is about 52. It doesn’t seem meaningful to compare an individual realization with the ensemble mean since the mean is a function of all of the realizations. But if you were to ask me if some observation exactly equaled the value of a single realization would this guarantee “consistency”? My answer would be “No” — see 1 above.
3. 52.25
PS. James, my sense is that when you decide to have a conversation aimed at honestly exploring why we have different views on this topic, and you drop the attitude, snark, and bad will, it will be much more satisfying for both of us and the readers. If you are not interested in such a conversation, then lets just not have it. Fair enough?
May 18th, 2008 at 8:46 am
Boris:
http://www.realclimate.org/images/trends_dist.jpg
The black histogram is labeled “2000-2007″
The text says “This figure shows the results for the period 2000 to 2007″
May 18th, 2008 at 12:05 pm
Oh, dear, Roger, you seem to have accidentally posted a link to a figure without the caption, and forgotten to properly cite it, and forgotten to show an ellipsis indicating that you left out something meaningful from what you quoted.
These little errors can be corrected.
Let me try to help. Your excerpt is from this:
“This figure shows the results for the period 2000 to 2007 and for 1995 to 2014 (inclusive) along with a Gaussian fit to the distributions. These two periods were chosen since they correspond with some previous analyses. The mean trend (and mode) in both cases is around 0.2ºC/decade (as has been widely discussed) and there is no significant difference between the trends over the two periods. There is of course a big difference in the standard deviation – which depends strongly on the length of the segment.”
See the thread for the full text from which I excerpted the above immediately above the figure:http://www.realclimate.org/index.php/archives/2008/05/what-the-ipcc-models-really-say/langswitch_lang/pr#more-564
There, that’s better. Boris was right after all, eh?
May 18th, 2008 at 12:14 pm
Hank-
What are you saying?
Are you actually claiming that the figure does NOT show temperature trends projected by the IPCC for 2000-2007?
May 18th, 2008 at 1:36 pm
I am intrigued by Tom C. and Nick S.’s comments. They seem to be experts in “the statistics of comparing model outputs and their averages to observations” as I suspected existed in my initial post. Even in my own humble field, we do checks with models and sensitivity analyses. So I have a question and two suggestions.
Question 1. Where could we look for a formal sensitivity analysis for climate change models? Did the IPCC do one for all models, or does each model developer conduct a sensitivity analysis as part of model development?
Suggestion 1. Nick and Jim are from the financial and chemical worlds. Wouldn’t it be interesting to survey scientific disciplines to see what each discipline does in terms of model comparison with real world data, and what are the cultural norms different scientific communities have (I hypothesize that they are in fact different, as they are different between economics and biological fields I work in). This could be a fascinating graduate student topic, IMHO.!
Suggestion 2. Or each discipline could nominate its top modeler to a committee to review the topic “climate models testing” and make recommendations (time to call in the National Academy of Sciences?), perhaps funded by NOAA, who is involved in model development and I would think would be very interested in this topic.
May 18th, 2008 at 3:30 pm
Roger,
Nick S and Nick Stokes are actually different people. It is an amazing coincidence that we both posted at about the same time (and made the same mistake (induced by an error message) leading to double posting).
May 18th, 2008 at 3:45 pm
Roger,
Try looking at the RC plot again at full resolution.
http://www.realclimate.org/index.php/archives/2008/05/what-the-ipcc-models-really-say/
It is quite clear that the heights of the histograms centred on -0.25 and -0.15C/decade are 2 and 4 respectively, and at +.55 and +.65 we find 3 and 1 simulations. Add to that roughly half of the 3+6 simulations in the boxes which are bisected by the limits of your proposed “95% consistency range” and we can estimate that certainly 10, and probably about 14, of the models will be rejected at the 5% level by your proposed range of acceptable trends. (Note of course that the x-axis there is degrees per year, so 1/10th of the values I use)
Do you actually know what “a p-value of 5%” means in the context of null hypothesis significance testing? Check Wilks 5.1.4.
I’d be very interested in seeing what calculation you propose to support your estimated consistency range. But if the resulting range excludes more than about 5% of the models, you will still have plenty of explaining to do!
May 18th, 2008 at 3:55 pm
Doc, it would be a mistake to examine climate science in the same way as real world scientific disciplines. Climate models are purposely made to be unfalsifiable. The real world examples you refer to–chemical engineering and finance–require verification and validity testing because intelligent people are putting real money on the line.
In climate science, it is bureaucrats and politicians who are putting money–other people’s money–on the line. Not intelligent people. Bureaucrats and politicians. Those are the only people that climate scientists must answer to concerning their models.
Roger has committed an unfortunate faux pas to even bring the matter up. Climate scientists must never be questioned. It is a matter of academic propriety in the brave new politically correct scientific world that we inhabit in academia today.
May 18th, 2008 at 3:58 pm
“Perhaps James is asking and answering whether the past 8-years falls within the spread of all possible 8-year trends presented in climate models.”
No, I am answering the question about whether the recent observations are consistent with the models at the 95% level.
I don’t know of any other possible way of interpreting this question other than the trivial calculations I have presented. I’ve quoted chapter and verse from an intermediate-level stats book that explicitly supports my approach.
You, on the other hand, have drawn some pictures, waved your hands, and said that “the distributions are different” without any explanation as to why you think that has any bearing on the matter. Further, you just proposed a range of trends “consistent at the 95% level” that excludes about 25% of the models themselves!
Call it snark if you like, but I call it frustration at trying to explain why black is not white, to someone who demonstrates over and over again and again that he does not even know what black and white mean, but still insists on repeatedly making false assertions regarding them.
May 18th, 2008 at 4:15 pm
Roger, you are a man of great patience. You continue to argue meaning and are relentlessly confronted with arguments of statistical consistency that defy ordinary expectations of the meaning of the word consistency.
I went back and read NickS’s comment that not many financial institutions would find models such as these useful. I hypothesize that it is because (unlike governmental agencies) it is not other people’s money, there is a natural meaning of consistency, and here is a real cost to the modeler for getting it wrong.
I also believe that NickS is correct that the issue is in the Greeks. I would be much happier if I knew the model parameterizations. We could be arguing about real stuff in the models. For Example:
1. It would be much more interesting if I knew that a model expected intermediate results to be lower by a specific amount in an intermediate period under the influence of La Nina. In fact, I cannor tell whether models consider the Multidecadal oscillations.
2. I would be happier if I knew that the models considered Total Solar Irradience. Given the IPCC’s dismissal of Solar Variation as a source of Global Warming, I suspect it is not there at all. I suspect that political correctnes dominates and no one has a model that gives any weight to this phenomenon that exibits a higher correlation to temperature variation than CO2 concentrations.
3. We could argue that there is a better model.
The core issue of the skeptics is that natural causes dominate long term warming trends.
As near as I can tell, the modelers and AGW alarmists, argue that
1. The models are consistent with observations without consideration of natural causes.
2. The science is settled and needs no debate
3. Repeated ad nominem attacks on those who disagree are an adequate substitute for science.
The issues are in meaning. I wish the issues were in science, but it is altogether fitting that this is a political science blog.
May 18th, 2008 at 4:53 pm
James Annan-
You have now shifted from talking about the normal distribution to the histogram. My answer before was with respect to the normal distribution, as that is what you asked me about. Clever switch.
You keep talking about “consistency with the models” and I have repeatedly said that I am interested in a comparison of observations and forecasts. There are different questions — models are not forecasts.
It may very well be that more than 5% of the forecasts are inconsistent with the observations (imagine if I just added 55 more forecasts to the ensemble, all of which are inconsistent with the obs) with a mean of .19 (like the current distribution) but all of which lie way outside the current 95% range. The addition of these 55 new realizations will dramatically expand the range of the modeled distribution (hence the range of consistency), but far more than 5% of the realizations in the new distribution will be inconsistent with the obs.
You can keep confusing “models” with “realizations” but this just underscores how we are talking about different things.
You write, “I don’t know of any other possible way of interpreting this question other than the trivial calculations I have presented.”
It is not my fault that you see only one way to address these questions. As I say in The Honest Broker on issues of uncertainty, ignorance is bliss;-) By contrast, here is how the WMO Working Group on Forecast Verification explains the challenge:
“A colleague of mine used to ask me, “Isn’t there just one statistic that would give the accuracy of the forecast?”
It would be nice if things were that simple, but they rarely are! Typically we want to measure the accuracy and skill of a forecast system, which means that we have a large number of forecasts and observations covering a domain in time and/or space (rather than a single forecast / observation pair). There may be occasions when all that we care about is the average magnitude of the difference between the forecast and observations (in which case the mean absolute error would be the appropriate statistic), but usually we are interested in knowing more. Questions that we might like to answer include:
* Was the forecast magnitude correct?
* Was the forecast biased?
* How often the forecast make an unacceptably large error?
* Did the distribution of forecast values resemble the distribution of observed values?
* Was the timing correct?
* Did the forecast put the event in the right place?
* Did the forecast event have the correct size and duration?
* Was the trend correct?
It is hard to imagine one statistic that would address all of those issues! It is pretty clear that a number of statistics are needed to give a useful description of the forecast system’s performance, and to meet the needs of different users for information about particular attributes of the forecast. Some of the questions cannot easily be answered using standard scores, and one must either examine the forecasts and observations by eye, employ a distributions oriented approach (Brooks and Doswell, 1996), or use a more sophisticated diagnostic verification method.”
http://www.bom.gov.au/bmrc/wefor/staff/eee/verif/verif_web_page.html#Hamill%202001
May 18th, 2008 at 6:02 pm
Roger,
Thanks for your substantive response to my discussion of a paradoxical t-test outcome above. But I think that we need to set aside whatever was said at RC and come back to what the IPCC said. And while I actually agree with Boris that it’s unclear that they said anything testable about the trend in 2000-2007, let’s say that they did.
Then that is a single realisation, a number. It doesn’t have a distribution. You can take the IPCC mean as a prediction of the number, but the IPCC spread isn’t trying to predict anything.
After the fact, you still don’t know that number, so you have to identify it as best you can with something like a regression. This will be based on a model involving past data and will have a spread. It’s also trying to “predict” that one realisation.
Now these are totally independent processes. The regression spread should be less than the prediction – it’s using hindsight. So it’s not surprising that a t-test could say they are from different distributions. They are. And the t-test will reject even if the realisation accords with the predictions, but the post-facto identification procedure has a tighter variance than the prediction procedure.
May 18th, 2008 at 6:40 pm
Nick Stokes-
First, that is pretty funny/odd that we got two Nick S comments from different people 2 minutes apart! I’m sure that is outside some distribution
I understand your point, and have two replies.
1. On the IPCC, please see Figure 10.26 on p. 823 of IPCC AR4 WGI, here:
http://www.ipcc.ch/pdf/assessment-report/ar4/wg1/ar4-wg1-chapter10.pdf
Bottom series of panels for various temp predictions for a range of scenarios. Interestingly the std dev of the trend increases with the time horizon. I am not sure how to interpret this, but it has been the subject of much discussion over at Lucia’s blog
2. The IPCC prediction (conditional projection) is based on a distribution, in that case 19 different models.
Thanks!
May 18th, 2008 at 7:00 pm
“James Annan-
You have now shifted from talking about the normal distribution to the histogram. My answer before was with respect to the normal distribution, as that is what you asked me about. Clever switch.”
Please don’t be silly and stop all this ducking and weaving. The question is essentially the same either way. In terms of the normal distribution N(0.19,0.21), what proportion of this distribution is outside the (-0.05,0.45) bounds that you propose?
Hint 1: the answer is not close to 5%. Hint 2: it should be, because *that is precisely what the p-value of 5% means*.
May 18th, 2008 at 7:16 pm
“James Annan-
You have now shifted from talking about the normal distribution to the histogram. My answer before was with respect to the normal distribution, as that is what you asked me about. Clever switch.”
Please don’t be silly and stop all this ducking and weaving. The question is essentially the same either way. In terms of the normal distribution N(0.19,0.21), what proportion of this distribution is outside the (-0.05,0.45) bounds that you propose?
Hint 1: the answer is not close to 5%. Hint 2: it should be, because *that is precisely what the p-value of 5% means*.
May 18th, 2008 at 8:19 pm
Roger
Not only do you have to find a helpful undergraduate, but you have to explain the problem correctly to him/her. I think that’s where you went wrong.
May 18th, 2008 at 8:24 pm
James-
You can find my reply in the form of UPDATE #2 appended at the end of the original post:
http://sciencepolicy.colorado.edu/prometheus/archives/prediction_and_forecasting/001431the_helpful_undergra.html
Clearly under the red curve far more than 5% of the realizations are inconsistent with the data, because I designed them that way! But in this case you would say that we have improved the forecasts because the observed point falls closer to the center of the distribution. So I say any approach that leads to greater “consistency” by adding worse forecasts to your distribution fails the common sense test.
May 18th, 2008 at 8:29 pm
Mark-
Thanks, all of the action is in how to look at this problem. My most recent response to James indicates why I think he approach to this problem is logically and practically flawed. He wants to argue about the implementation of his method, I am suggesting that there are other, likely better was to look at this problem.
He may not want to admit there are different ways to look at this problem, but there are a lot of ways to do forecast verification, not just one.
May 18th, 2008 at 8:58 pm
Apologies for the flippancy in the previous comment, but I have found this exchange incredibly frustrating. From my point of view, James Annan and John V. are obviously right and you, Roger, are obviously wrong. The only reason I can see why this exchange could have continued so long with so little progress is confusion and/or disagreement about what the problem is.
The IPCC models deal with an ensemble of possible worlds (virtual worlds, but hopefully with some degree of realism). In this ensemble, 8-year trends have a lot of variability (did someone say N[0.19, 0.21]?). So if we measure an 8-year trend and find it anywhere between (roughly) -0.23 and +0.61 it’s consistent with the model. But, you say, that’s a huge range, almost any conceivable measurement would be consistent with it, and so the models are not giving sufficiently precise predictions to be useful for anything. Well, maybe, maybe not, but then who has suggested that the IPCC models are intended to forecast the change in global average surface temperature over the next 8 years?
I’ll stop with that question for the moment, because it occurs to me you might think someone *has* made that suggestion and, if so, perhaps we should examine that issue.
I could go on, but I’ll stop with that question
May 18th, 2008 at 9:16 pm
Roger, you still ducking this simple question.
What proportion of samples drawn from the null distribution are rejected by your proposed test of “consistency at the 5% level”?
That is, what is the probability of your test falsely rejecting in the case that the null hypothesis is true?
I’m not interested in whatever new straw man you are trying to bring up. I’m asking about the performance of your test on samples taken from the distribution defined by the models – and no, it doesn’t matter whether we use the finite 55-member sample, or the gaussian fitted to it.
May 18th, 2008 at 9:17 pm
Sorry for the trailing sentence in that last comment. I never was very good at proof reading.
May 18th, 2008 at 9:31 pm
Mark-
Thanks.
As background to this little debate, I have asked (for a while on our blog what observations of the climate system on short time scales would be inconsistent with the forecasts from climate models?
The reason for his question is the frequent assertion by climate scientists that this or that short-term observation is “consistent with” forecast of climate models. But for “consistent with” to have any meaning there must also be a class of obs “inconsistent with.”
It has been proposed that surface temp trends would be a good variable to use to answer such a question. Lucia Liljegren (of Argonne Nat Lab) posted up some interesting ways to frame this question consciously departing from the model proposed by James Annan. She has asserted that recent temp trends are inconsistent with IPCC forecasts on the same time scale. Real Climate weighed in and said the opposite. I have commented hat I can see Lucia’s argument, and it has merit. James called me a idiot, and you’ve seen the rest. (I’ve got little respect to professionals who act like junior high kids on their blogs.) This is a quick summary of dozens of blog posts and hundreds of comments, but feel free to wade though it all if you’d like.
Anyway, surface temp trends may not be the place to look, as suggested on this thread by Michael Tobis.
But I will repeat, any test of consistency that means that more bad forecasts (ie. a greater spread in your ensemble) implies greater consistency is just nonsense. It means that the problem has been framed in a way that is at best misleading.
I hope this quick little summary is of some use. The debate is about how to frame the problem, not about stats 101;-)
May 18th, 2008 at 9:40 pm
James-
I haven’t done the test, but since you want a number, let me make one up that I’d be happy with, and make it sufficiently large to give you something clearly away from 5%, which is what you are looking for from me, so how about 12?
And in my “strawman” example the number would be something like 67. Do you understand why this example matters? Does it concern you that I can add 55 new realizations that are really bad forecasts and it improves the consistency of obs and forecasts? Are you comfortable ignoring this point?
Let me again repeat — I am not arguing with you about how to implement the statistical test that you want to apply. I am saying that the choice of test is wrong — as in misleading, not useful, and not a good way to compare observations and models in this particular case, though it is a very useful approach in other cases, like drawing balls from urns.
If you want to continue to assert that you have the one true way, then great, and good for you. But any one true way that rewards large distributions of really bad forecasts with high marks for “consistency” between obs and forecasts is a pretty useless approach, which I think mis just common sense.
May 18th, 2008 at 10:31 pm
Well I’m relieved that you have eventually acknowledged that your test of consistency at the 5% level actually rejects more than 20% of samples from the null distribution (the exact answer is 13/55 = 24% of the models, or ~23% of the Gaussian distribution N(0.19,0.21), since you seem to think that my using one rather than the other was some attempt at a dastardly trick).
I would be very interested to hear your explanation as to what you think the _5%_ actually means, in a test of consistency at the _5% level_.
While awaiting a reply to that, I will happily say that of course if the models had a wider spread, they would be consistent with a wider spread of observations, according to any plausible interpretation of the term “consistent”. Would you prefer it to be the other way around?
Certainly there are numerous other ways to look at forecast skill and performance, although many of them don’t make much sense for a single realisation. “Consistency with observations” is by no means the one true measure of model performance. But it is a relatively straightforward and elementary one, with a widely-accepted interpretation that is ubiquitous across the entire world of statistics, and it has a simple and direct answer that you have repeatedly and stubbornly got wrong. Indeed you continue to get it wrong with each new post. Don’t you think it’s important to make sure we agree on the undergraduate-level stuff before we try to move onto more complex ideas?
May 18th, 2008 at 10:33 pm
Sorry, too many questions. To avoid any digressions, the one I’m interested in is the first, that is what do you think the 5% actually means, in a statistical test at the 5% level?
May 18th, 2008 at 10:55 pm
[I'm having to retype this because of a TypeKey timeout error or something. In reading it, please remember that it was much more cogent the first time.]
If a model predicts that a variable will be in the range a+/-b and we want to test the model by comparing its prediction with measurements of that variable, then an increase in b *will* mean that the model is consistent with predictions over a wider range.
Now, Roger, you say:
“But I will repeat, any test of consistency that means that more bad forecasts (ie. a greater spread in your ensemble) implies greater consistency is just nonsense.”
No. But a large spread in the predictions does mean that the test is weak. And I submit that 8-year trends in global average surface temperature provide a weak test for the IPCC ensemble of AOGCMs.
May 18th, 2008 at 10:57 pm
I *said* it was more cogent the first time round.
I meant “an increase in b will mean that the model is consistent with *measurements* over a wider range.”
May 18th, 2008 at 11:36 pm
Oh, and…
What James said.
May 19th, 2008 at 5:23 am
“an increase in b will mean that the model is consistent with *measurements* over a wider range.”
No Mark, an increase in the range of projections means that the model (or ensemble of model runs) is even worse than before for policy support since it’s value for prediction is even less. That concept is really so simple that it is quite bizarre for anyone to argue the contrary. This is why statistics is so often mocked: people too often use it to argue black is white.
Furthermore, to confirm what Roger said, computer modelers usually never apply a normal distribution to a collection of biased model runs since it is patently not random, unlike observations.
Responsible computer modelers search for as many tests that can verify their work as possible. To search for reasons not to test at all – worse: using inapplicable stats and faulty logic, is peculiar to certain modelers working in climate science. I say “certain”, because I cannot accept that such nonsense is the common or mainstream view of climate modelers.
Imagine trying to sell a computer program on the basis that “our huge range of uncertainties ensure that we can always bound the correct answer, just don’t ask us to tell you what it is”. Do you think you’d get any sales?
May 19th, 2008 at 6:52 am
In the same vein as the facile questions about undergraduate stats by JA above I’d like to ask him and the other members of the worse-is-better crowd, if any of you remember what the y-axis of the normal distribution means (hint – starts with p)? And what happens to this variable when you spread the base but keep the area the same? And what does this movement of the y-axis tell us about the data represented by x?
May 19th, 2008 at 8:08 am
James Annan-
A final response for this round:
A 5% test seeks to identify for a range of overlap between distributions of observations and forecasts whether they consistent with each other with 95% certainty.
Our debate is over what “consistency” means in this context and how it is to be measured using statistical tests, and based on our conversation so far, it is clear that we will have to simply agree to disagree.
JamesG understands the issue: “an increase in the range of projections means that the model (or ensemble of model runs) is even worse than before for policy support since it’s value for prediction is even less.”
Mark H seems to get it as well: “But a large spread in the predictions does mean that the test is weak. And I submit that 8-year trends in global average surface temperature provide a weak test for the IPCC ensemble of AOGCMs.”
Thanks all!
May 19th, 2008 at 9:55 am
James, in most other fields outside of “Climate Science” assertions such as your would be laughable. If your model doesn;t match observations to within 1 sigma it isn;t worth much.
In any other field where you actually had to produce a testable output you would be fired
May 19th, 2008 at 10:50 am
“The 5 observations are 5 measurements of *one* Swedish man’s height. The 55 models are single measurements of each of 55 different Swedish men. Both sets of data attempt to determine the average height of Swedish men. The variance is not the same.”
There’s someone making 5 measurements of *one* Swedish man’s height to determine the height of all Swedes? Who hired this person or group to determine the height of all Swedish men? And has the someone who answered that question (of the average height of all Swedish men) by measuring one man’s height 5 times been fired?

May 19th, 2008 at 12:08 pm
Arguing problems by analogy, be it streamflow or Swedes or sigma-firing, just muddies the water. It’s clear from the conversation here and at Lucia’s that communicating a correct problem definition is hard enough; why add a second challenge of determining whether analogies map correctly to the climate problem?
May 19th, 2008 at 2:20 pm
Tom:
It’s clear that James Annan would like to focus on one specific question, which evidently, he thinks is “the” question.
His question *is* important from an academic standpoint. If one is developing models, we do wish to know if the weather realization fell outside the range of all model predictions. His method is fine for answering that questions. No one disputes it.
The difficulty is that other people have different questions. It is perfectly valid to wish to know if the 2C/century, as a number, falls within the range consistent with actual weather over any period of time. It is perfectly valid to use the uncertainty intervals for real, honest to goodness weather (provided one can figure them out.)
This question can be asked even if we look at that central tendency as a number.
It is also perfectly valid to ask if (2C/century – 1-sigma) as a number falls within the range for the weather.
This is not the question James wants to answer, and evidently it’s not the question he wants us to ask. But we can certainly ask it. Moreover, it’s a question most consumers of predictions/ projections or forcasts ask.
As for my answer (or anyone else’s): it’s reasonable to argue what the correct size of the uncertainty intervals for the question I ask might be.
I’ve admitted mine may be wrong. I’m a mechanical engineer. But, as long as climatologists and statisticians simply refuse to address this questions, people are still asking it. Quite frankly, the people asking the question *know* they are not asking the question James is answering.
If people like James or those at RC want to put a halt to questions from skeptics and deniers, they need to learn to answer the questions the skeptics actually ask about models. All these questions relate to skill and not “inconsistency”.
Telling the skeptics they are asking the wrong question hasn’t been reducing the number of skeptics. Answering the question the do not ask will not reduce the number. These behaviors will continue not to reduce the numbers, and is more likely to have the contrary effect.
May 19th, 2008 at 2:34 pm
To make my previous comment a little more explicit by further scrambling analogies:
In comments Roger proposes a streamflow example. To correspond with the actual climate case under consideration, it would have to be reframed as follows.
The 55 are tasked with predicting streamflow over the next 100 days. In the course of doing so, they also report their mean predicted 20-day streamflow trend, .2. Later, examination of their runs shows that their best-guess model trends are distributed N(.19,.21), including uncertainty from intermodel differences and initial conditions but excluding within-model parameter uncertainty.
The 5 students measure streamflow over 8 days, reporting a trend distributed N(-.07,.07).
An observer notes that the samples differ according to an unpaired t-test, ignoring the violated assumption of unequal variance.
Another notes that the 20-yr mean model trend (0.2) lies outside the confidence interval of the measured trend (-.21 to .07), neglecting to mention that
a. to say that a particular value within forecast bounds can be rejected does not necessarily falsify the whole forecast or underlying models
b. 8-yr and 20-yr trends are not comparable unless one assumes a stationary trend and accounts for unequal variance
c. if trends have long-term structure, the variance of the measurement understates the true variance of the streamflow
By giving the modelers a failing grade, the instructor implicitly assumes that the short term measurement is the best source of information on the long term variance, and that the variance is constant over time. If the streamflow does in fact have high variance, then the effect is to penalize the forecasters for properly recognizing a property of the system under study.
May 19th, 2008 at 2:36 pm
For those, at least, who haven’t had a statistics course, opening this applet in another window and letting it run a while may be helpful.
http://javaboutique.internet.com/BallDrop/
May 19th, 2008 at 2:40 pm
Lucia- Extremely well said. Thanks you. I hope James reads it.
Tom- Thanks. This is exactly why analogies are useful.
Your alteration of the one I proposed suggests a different problem to be addressed — not right, not wrong, just different.
I agree with your a., b. here we have a stationary trend, and I don’t think that the unequal variances in this case lead to different conclusions than what you have presented, and c. then this variance should be incorporated in the model-produced forecasts on short time scales.
May 19th, 2008 at 3:50 pm
Roger: ‘Mark H seems to get it as well: “But a large spread in the predictions does mean that the test is weak. And I submit that 8-year trends in global average surface temperature provide a weak test for the IPCC ensemble of AOGCMs.” ‘
Please note that I did not say, “There are no strong tests for the IPCC ensemble of AOGCMs.” Nor did I say, “The AOGCMs used in the IPCC ensemble have not been tested.” Nor did I say, “AOGCMS can not be run in a way in which observed 8-year trends in GAST provide a strong test.”
And by the way, I would be very surprised if James Annan and the RC crowd disagreed with the statement. I think, in fact, that this is precisely the point they are trying to make,
I see you have a post on skill, Roger. I shall read that and attempt to understand it.
May 19th, 2008 at 3:51 pm
By the way, Roger, every time I post a comment, I get the message below. The post seems to succeed, but the message does not inspire confidence.
An error occurred:
Rebuild failed: Writing to ‘/home/html/prometheus/archives/author_pielke_jr_r/index.html.new’ failed: Opening local file ‘/home/html/prometheus/archives/author_pielke_jr_r/index.html.new’ failed: Permission denied
May 19th, 2008 at 4:03 pm
Thanks Mark- I think that I offered this option to James several times (a very weak test) and it was not accepted. I note the things that you did not say;-)
On the blog, apologies, the comments function is a mess , as you’ve noted, as are a bunch of other things. I am promised an upgrade of the software by our support group . . . we shall see.
Meantime, I am very appreciative of the people who go to the trouble of getting comments through our defenses;-) Just be sure you have a saved copy before hitting that “post” button!!
May 19th, 2008 at 4:13 pm
“Rebuild failed: Writing to ‘/home/html/prometheus/archives/author_pielke_jr_r/index.html.new’ failed: Opening local file ‘/home/html/prometheus/archives/author_pielke_jr_r/index.html.new’ failed: Permission denied”
Yes, I get the same thing. (I think. I’ve stopped paying attention.)
“Just be sure you have a saved copy before hitting that “post” button!!”
I almost always do at Real Climate (just so I have a record of the comments of mine they choose not to post). Here, I forget after many successful posts. (And then regret my laziness when a particularly long comment gets lost.)
May 19th, 2008 at 4:28 pm
“Our debate is over what “consistency” means in this context and how it is to be measured using statistical tests, and based on our conversation so far, it is clear that we will have to simply agree to disagree.”
You haven’t actually debated anything. You’ve presented some meaningless arithmetic, which rejects 23% of the models themselves, and simply asserted that this is a test of consistency at the 5% level. You have not any any point explained what problem your arithmetic attempts to solve. Merely labelling it a test at the 5% level does not change the fact that it actually rejects at the 23% level.
This is not a case of you stating uncomfortable truths in your self-appointed role as an “heretical” iconoclast. It’s simply a case of you demonstrating that you don’t know anything about statistics, and too stubborn to admit that you got a trivial point wrong.
Thanks!
May 19th, 2008 at 4:36 pm
Lucia-
James apparently did not read your comment;O)
James-
Not only all that, but I also showed you how you might be able to reject more than 50% of predictions (not models!!) with 100% certainty, simply by adding 55 nonsense models to your ensemble. Using similar “meaningless arithmetic” I could also show you how to reject 95% of predictions with 100% certainty.;-)
As Lucia writes, “It’s clear that James Annan would like to focus on one specific question, which evidently, he thinks is “the” question.”
James, I think everyone understands this now;-)
May 19th, 2008 at 4:38 pm
I’m interested in knowing when that time period is so that I know when the concept of “inconsistent with” has some actual meaning.
If you define consistent with as matching a realisitc distribution of a number of scenarios over a wide range of percentages. Then inconsistent is some unrealisitc distribution or too narrow range of percentages.
Forcasting “Between -32 and 106.” may give a correct andswer, but could be called inconsistent due to the extreme range of all possible answers making it meaningless.
May 19th, 2008 at 5:36 pm
Roger, quoting Lucia writes, “It’s clear that James Annan would like to focus on one specific question, which evidently, he thinks is “the” question.”
I think James is not the only one who gets frustrated when the question we are allegedly discussing keeps changing. As I understood the question, it was whether recent observed 8-year trends in GAST are consistent with the IPCC model ensemble. They are.
There are other interesting questions, like whether this comparison is a strong or weak test of the models. (Pretty weak, I say.) But please let’s not confuse these questions.
May 19th, 2008 at 5:48 pm
“As Lucia writes, “It’s clear that James Annan would like to focus on one specific question, which evidently, he thinks is “the” question.”"
No, I merely think that when the question is asked, it should be answered competently. You and Lucia both got it hopelessly, totally and utterly wrong.
Thanks!
May 20th, 2008 at 4:03 am
Lucia…
“It is also perfectly valid to ask if (2C/century – 1-sigma) as a number falls within the range for the weather.
This is not the question James wants to answer, and evidently it’s not the question he wants us to ask. But we can certainly ask it. Moreover, it’s a question most consumers of predictions/ projections or forcasts ask.”
I doubt that very much… 15C-18C is a weather forcast for tomorrow; most people care if the observed temperature falls within the range 15C-18C, not whether 16.5C lies within the observational uncertainty.
“not the question James wants to answer”
I’m not sure what you expect from James. You yourself have given the numerical “answer”. He and others have, multiply, explained why the question has little meaning. That is a deeper engagement/”answer” than repeating numerical results, no?
May 20th, 2008 at 4:28 am
Let’s see…
… given what we know of sensitivity to initial conditions in model worlds and the real one, there is a large stochastic error over short time intervals like 7 years(!)…
… there is no reason to a priori expect a mean of model realizations would fall within observational uncertainty, any more than to expect any single model realization would, any more than to expect the model mean would fall within the same observational bounds applied to a single model realization.
… so if Lucia’s/Roger’s test fails, it tells us nothing we don’t already know.
… if it succeeds, it’s by chance.
… if James’/RealClimate’s test fails, it tells us something is wrong with model physics, either that the stochastic error is too small or that there is a large systematic error (and the sign).
… if it passes, it tells us that there is no need to worry.
… complaints about spread make no sense… the spread is explicit… any competent individual can look at the spread and assess the usefulness of model predictions accordingly… any competent individual can reduce the number of models/evaluate models on an individual basis and thereby reduce the spread… the spread is what it is, the models are what they are, complaining the spread is wide does not make the test ‘wrong’ or justify using a bogus test with reduced spread… the spread reduces greatly over longer time periods… the time periods policy makers are interested in… so where’s the problem?
May 20th, 2008 at 7:06 am
Urs-
Do you really think that a 15-18C weather forecast for tomorrow is comparable to IPCC predictions for 2000-2008?
This contradicts your earlier assertion that the IPCC doesn’t produce such predictions.
The uncertainty in weather forecasts is calculated based on historical skill, and is not a product of model spread (though models are used qualitatively in making such forecasts) and this is fundamentally different than the model-spread argument that you are advancing for evaluating IPCC predictions.
It is exactly this sloppiness in reasoning that is problematic. Weather forecasts and climate forecasts do not have the same type of uncertainties.
May 20th, 2008 at 7:50 am
Mark–
You suggest the question “we” are allegedly discussing keeps changing. The difficulty is who do you think “we” are.
One of the problems we have in all debates or political conversations is that different people have different questions. One group of people have been asking the question Roger and I are discussing for quite a long, long time.
They didn’t change their question. It’s the same unanswered questions.
You, James, Gavin, WC and countless other people in blogs and forums can keep answering that other– almost academic (and easier) question– over and over. No one is disputing your answer to that question.
But it is not now, and has never been, a question those who dispute your view have been asking.
James may not like my answer. He may know a better way to answer it. But as long as those who are in the more “activist” camp either a) refuse to even engage this question, or b) provide ridiculous answers like the graph showing downturns after volcano eruptions,
others are going to have to shift for themselves on the statistics. This will involve discussing ideas in a public forum (a blog) and asking each other for bits of information we can assemble to find the answer.
If this bothers James, then tough.
May 20th, 2008 at 8:50 am
The difficulty is that other people have different questions. It is perfectly valid to wish to know if the 2C/century, as a number, falls within the range consistent with actual weather over any period of time. It is perfectly valid to use the uncertainty intervals for real, honest to goodness weather (provided one can figure them out.)
I agree that it’s perfectly valid to ask the question. I think at least many if not most here and at your blog understand the difference. The problem is one of terminology. When you say “IPCC falsified,” the wider world doesn’t get that there’s a difference between identifying an observed trend that lies outside the (possibly too large) confidence interval of a forecast, and identifying some portion of a forecast that lies outside a (likely too small) confidence interval on the observed trend.
May 20th, 2008 at 9:03 am
Roger, I’m not Urs.
“It is exactly this sloppiness in reasoning that is problematic. Weather forecasts and climate forecasts do not have the same type of uncertainties.”
Is it sloppy reasoning though? You have not established this ‘difference in type of uncertainty’ is problematic for the analogy. All you have established is that there is a difference.
If I give a prediction for warming over the next eight years as the range 0.05C-0.15C, most people would expect the observed temperature anomaly to lie in that range if the prediction is consistent with observations. That expectation does not change if I tell them the model(s) used were statistical or physical.
May 20th, 2008 at 9:13 am
Lazar- Thanks for the correction and sorry for responding to the wrong name, I plead pre-coffee;-)
The problem is that the worse the forecast (ie., the greater the uncertainty, defined as the width of the range, the greater the “consistency”). While this can be defined to pass certain statistical tests, it fails what I would call the common-sense test. I can guarantee you that if I predicted that tomorrow’s weather will see a high temperature of between 40 and 100 degrees and then trump my predictive success when the temperature is observed to fall in this range, it would not be received as a meaningful accomplishment.
A further problem that we have highlighted is that the IPCC presented a very narrow range of error bars in its 2007 report for short-term trends in temperature (figure 10.26, chapter 10). Now it is either the case that recent trends fall outside of that uncertainty range, or the IPCC made some bad decisions in how it chose to present such uncertainties.
May 20th, 2008 at 9:14 am
To clarify: the first half of my previous post (8:50am) is a quote from Lucia – I didn’t realize that my html tag wouldn’t come through.
I’d further note that “It is perfectly valid to use the uncertainty intervals for real, honest to goodness weather” is true, but “(provided one can figure them out.)” remains to be demonstrated.
May 20th, 2008 at 9:57 am
Roger: “But I will repeat, any test of consistency that means that more bad forecasts (ie. a greater spread in your ensemble) implies greater consistency is just nonsense. It means that the problem has been framed in a way that is at best misleading.”
Technical meaning may not always match intuitive meaning, but we are scientists and should not resort to the sort of argument where a “tightly constrained” result is one that requires liberation.
It is indeed the case that every possible result is consistent with a theory that anything can happen, and that very few results are consistent with a very tightly specified theory. This doesn’t mean that vagueness is *better* than precision; it just means it’s *harder to falsify*. Frankly, one doesn’t expect a scientist to construe this as “misleading”. On the contrary, it seems rather obvious.
Essentially, it’s easier to satisfy a vague promise than a precise contract. The question of consistency is raised by you and others questioning the modeling enterprise, not by the modelers. The idea seems to be that observations call the model projections into question at the global scale. To make that claim you have to show that the observations are inconsistent with model predictions. You can’t actually get very far doing that because the GCMs make very modest claims about near-term global temperature change.
If there is any misframing you are the one who set out the frame in the first place.
May 20th, 2008 at 10:11 am
Michael-
I’ve documented many claims by scientists that short-term observations are “consistent with” observations. If you are suggesting that what these scientists really mean when they say this is that “models make very weak claims,” then I’m surprised, because when I see such statements I interpret them to say quite the opposite.
The IPCC AR4 even touts a six-year warming period (post-TAR) as adding weight to its claims. Further IPCC presents its near-term temperature predictions as having very small error bars.
Such claims by scientists and the IPCC lead people in the professions of policy research and decision making to ask, “what could these scientists mean with such claims?”
When efforts to resolve this question are met with responses that “technical meaning may not always match intuitive meaning” then we have a problem. If the IPCC is indeed to support decision making then it should present its findings in ways that make intuitive sense to decision makers. Consider this exercise an effort in that direction.
Obviously, we are not there yet.
May 20th, 2008 at 10:14 am
Sorry, should have said “I’ve documented many claims by scientists that short-term observations are “consistent with” predictions.”
May 20th, 2008 at 10:26 am
“If the IPCC is indeed to support decision making then it should present its findings in ways that make intuitive sense to decision makers.”
The IPCC is only intended to support a pre-determined decision that governments should be involved in limiting CO2 emissions.
May 20th, 2008 at 11:04 am
OK—GCM’s have made their way into to public debate via wild claims either by the modelers or the media. Let’s phrase the question(s) in another way that the public which is being asked to sacrifice their lifestyle should be allowed to ask of the modelers:
1 Do the GCM prove beyond a reasonable doubt that catastrophic global warming is imminent?—NO
2.Do the models predict the recent downturn in the last 6-10yrs of the Earth’s global temperature —NO
3. Do the climate models simulate using ALL physical potential climate drivers (ie PDO,AMO,ENSO–etc)—NO
4. Has Lucia shown that within a reasonable doubt that the recent temperature observations don’t match short-term IPCC projections—Yes
May 20th, 2008 at 11:07 am
Roger, no caffeine at 7:06 am, I can understand.
“The problem”
… a problem, ok there’s a problem…
“that the worse the forecast (ie., the greater the uncertainty, defined as the width of the range, the greater the “consistency”).”
… is that a problem? Why? It’s the nature of the beast. A wider prediction is more likely to be consistent with observations. As long as one is aware of that fact, it ought not to be a problem.
I think uncertainty needs to be approached head-on, it can’t be wished away and ought not be ignored.
… I can accept that observations are consistent with model predictions over eight years
… and I can accept that the predictions are weak due to large uncertainty
… and note that the large uncertainty is reduced considerably for twenty year predictions
… and that eight year predictions are not very useful in terms of GHG policies.
… it is even desirable that stochastic variability in the real world climate is represented in the uncertainty of predictions.
“While this can be defined to pass certain statistical tests,”
This means you agree model predictions pass the test for consistency?
“it fails what I would call the common-sense test.”
… that is much too vague.
“I can guarantee you that if I predicted that tomorrow’s weather will see a high temperature of between 40 and 100 degrees and then trump my predictive success when the temperature is observed to fall in this range, it would not be received as a meaningful accomplishment.”
… but that is not a test, “common-sense” or otherwise. It is a statement of fact. It is the nature of prediction and consistency you are describing.
To repeat my previous comment…
“… complaints about spread make no sense… the spread is explicit… any competent individual can look at the spread and assess the usefulness of model predictions accordingly… any competent individual can reduce the number of models/evaluate models on an individual basis and thereby reduce the spread… the spread is what it is, the models are what they are, complaining the spread is wide does not make the test ‘wrong’ or justify using a bogus test with reduced spread… the spread reduces greatly over longer time periods… the time periods policy makers are interested in… so where’s the problem?”
repeat… I still can’t see your problem.
“A further problem that we have highlighted is that the IPCC presented a very narrow range of error bars in its 2007 report for short-term trends in temperature (figure 10.26, chapter 10). Now it is either the case that recent trends fall outside of that uncertainty range, or the IPCC made some bad decisions in how it chose to present such uncertainties.”
On that basis, the latter I think. I prefer the approach in figure 10.5, where they plot the average for each model. I think the best approach is, as RC did, plot all the model realizations, or the ensemble mean with 2sd error bars of the individual realizations, or the normal distribution. I also would prefer winnowing out models. Testing them individually. Rejecting some maybe.
Anyway, thanks for the polite reply.
You are a gentleman as always.
May 20th, 2008 at 11:13 am
Roger -
Your alteration of the one I proposed suggests a different problem to be addressed — not right, not wrong, just different.
I agree that they’re different. I assert that only one can be right in the sense that it is a better mapping of the climate problem. Which is it? That’s why I think it would be more productive to focus on a clear definition of the climate problem.
I agree with your a., b. here we have a stationary trend, and I don’t think that the unequal variances in this case lead to different conclusions than what you have presented, and c. then this variance should be incorporated in the model-produced forecasts on short time scales.
The variance in c. is incorporated in the model forecasts, to the extent that models’ endogenous variability has a >8yr component, which appears to be the case. Re b., I’m not sure what you mean, but the short term temperature trend on earth seems clearly variable.
The crucial problem with using the 8yr trend confidence interval to evaluate a prediction (e.g. .2C/decade) is that it excludes the >8yr noise. Thus the confidence interval on the measurement is too narrow, and the recent data is less informative about underlying forced response than it appears to be.
The problem is finding the “true” variability. Lucia noted that the model envelope might overstate it, because
ss(models)=ss(model_weather)+ss(intermodel)
(where ss = sigma squared). That could be true, though it could also be the case that ss(model_weather)>ss(model_weather) or that ss(models)>>ss(true_weather).
The 8yr trend of the observations understates the true variability, because
ss(true_weather)=ss(8yr)
Actually it’s more complicated than that because one should also account for variation in forcings and measurement error.
Suppose we split the difference and assume that “true” variability is .14 – halfway between the measurement (.07) and the models (.21). You still can’t use the unpaired t-test you linked to evaluate this, because N(trend_msmt) = 1, not 5 (plus, the trend isn’t even a measurement … it’s a statistic a set of measurements). Assuming normality of the observational trend and model distributions, the difference between N(-.07,.14) and N(.19,.14) is distributed N(.26,.2), which means you can’t reject 0 difference with any confidence.
May 20th, 2008 at 2:13 pm
Argh … again I’ve forgotten about lack of tags. 1st and 3rd paragraphs of my 11:13am post are quotes from Roger’s comment (19th, 2:40pm).
May 20th, 2008 at 2:26 pm
Lazar: “the spread reduces greatly over longer time periods”
Have you actually looked at the scenarios? In fact the opposite is true. This touted idea that a longer time period is better for predictions is completely offset by the uncertainty about future emissions. We might be able to test it 20 years from now but what use is that? You might as well admit that the models are useless. Indeed a model that isn’t testable is the very definition of useless. The only way forward is to ditch the idea of model ensembles and concentrate on the few model runs which seem to match the obs better. This is incidentally, standard practice outside of climate science.
Also people are blithely repeating, as if it was fact, that the inability to predict the climate in the past 8 (or 10) years is due to “weather noise”. This is of course a gross assumption with zero scientific justification behind it. It could in fact be the start of a new trend or even a new cycle. If someone was to actually define what this weather noise consisted of, as opposed to the current hand-waving, then I might be inclined to believe they actually knew what they were talking about. There is however a reasonably good meteorological explanation – anyone want to make a stab at it?
I’d also like climate modelers to estimate the amount of warming weather noise in the 1975/1998 period and maybe someone from Hadley centre could tell us why they were so convinced that natural variability couldn’t explain the late 20th century warming when quite obviously they cannot quantify natural variability at all.
Does anyone think that realclimate will bet on the observations coming back up to join the IPCC model ensemble 10 years from now? Not even the middle, just perhaps the bottom boundary? Me neither!
May 20th, 2008 at 3:29 pm
“Such claims by scientists and the IPCC lead people in the professions of policy research and decision making to ask, “what could these scientists mean with such claims?”
When efforts to resolve this question are met with responses that “technical meaning may not always match intuitive meaning” then we have a problem. If the IPCC is indeed to support decision making then it should present its findings in ways that make intuitive sense to decision makers.”
Hiring a translator might help?
Why are not informations on policy matters presented to policy makers in real world terms and not vague specialized scientific or statistical terms? Can you blame the German speaker for not understanding what the French speaker meant if the words are wrong? Do you blame the electronics student on her first day for not knowing how to build a working flipflop from discrete components?
“There is however a reasonably good meteorological explanation – anyone want to make a stab at it?”
I will stab. PDO and IPO and AMO changes alone and in relation to each other?
May 20th, 2008 at 4:01 pm
Lupo- Your comment reminds me of something I wrote on this exact subject in 2003:
“Consider the following analogy. You wish to teach a friend how to play the game of tennis. You carefully and accurately describe the rules of tennis to your friend, but you speak in Latin to your English-speaking friend. When you get onto the court, your friend fails to observe the rules that you so carefully described. Following the game, it would surely be inappropriate to criticize your friend as incapable of understanding tennis and futile to recommend additional tennis instruction in Latin. But, this is exactly the sort of dynamic observed in studies of public understanding of scientific uncertainties. For example, Murphy et al. (1980) document that when weather forecasters call for, say, a 70% chance of rain, decision makers understood the probabilistic element of the forecast but did not know whether rain has a 70% chance for each point in the forecast area, or that 70% of the area would receive rain with a 100% probability, and so on. Do you know?”
Pielke, Jr., R.A., 2003: The role of models in prediction for decision, Chapter 7, pp. 113-137 in C. Canham and W. Lauenroth (eds.), Understanding Ecosystems: The Role of Quantitative Models in Observations, Synthesis, and Prediction, Princeton University Press, Princeton, N.J.
http://sciencepolicy.colorado.edu/admin/publication_files/2001.12.pdf
May 20th, 2008 at 4:53 pm
JamesG…
“Have you actually looked at the scenarios? In fact the opposite is true.”
… you seem to have a problem with opposites… what you say with regard to scenarios does not contradict what I wrote although you claim it does… just like in response to Mark, you wrote…
“No Mark, an increase in the range of projections means that the model (or ensemble of model runs) is even worse than before for policy support since it’s value for prediction is even less.”
… did not contradict what he wrote, though you claimed it did.
“This touted idea that a longer time period is better for predictions is completely offset by the uncertainty about future emissions. We might be able to test it 20 years from now but what use is that? You might as well admit that the models are useless.”
… predicted temperature anomalies diverge among emissions scenarios as a function of time… a prime utility of models is to show policy makers how temperatures will be effected by different emissions levels… you are now claiming that showing this shows the models are useless(!)… or maybe you mean the range of predicted temperature anomalies for a given scenario increases as a function of time due to systematic differences between models, i.e. they produce different average trends in response to the ’same’ forcing… but the discussion so far has been on the spread of trends, which do converge as a function of time.
May 21st, 2008 at 6:11 am
Lazar
I take your point without actually agreeing with it, and I won’t go into a you said, he said discourse, but I’ll admit to trying to cut through the verbiage to point out the utility or lack of it of models for policy. The word “consistent” has been abused by a few correspondants here to the point where it is utterly meaningless. Statistical distributions too are being wrongly used to try to argue the opposite of reality. If I wish to remind people of this reality once you cut away the weasel wording it means bringing up a line of thought that people have apparently not bothered to consider. Perhaps you might try the same.
Models must be tested to prove their usefulness. It is up to the modelers to define and carry out these tests, which they consistently refuse to do whilst taking umbrage with others who attempt it. You are propounding the view that the models are a priori useful despite them being untested and unproven. As such you demonstrate little more than confidence in the efforts of the modelers, despite much evidence of clear bias in the modeling assumptions and much real world evidence that the models are indeed very poor for any sort of prediction at all. I’d describe such blind faith as anti-science, pro-activist.
May 23rd, 2008 at 10:40 am
If “the models” are to show policy people what different emissions levels will do to climate and the scenarios all have the emisssion levels wrong and too high – then what use are they?
If they can’t predict less than 20 years with any skill – then what use are they?
If they are simply “not inconsistent” with observations – then what use are they?
If the last 40 years has each 10 year period going backwards from 2007 showing about a .15 to .20 anomaly trend rise, what is the use or importance in saying it will continue?