Atlantic SSTs vs. U.S. Hurricane Damage – Part 2
October 24th, 2006Posted by: Roger Pielke, Jr.
In the comments of our first post on this subject FSU’s Jim Elsner, a widely respected hurricane expert, pointed us to a forthcoming paper (here in PDF) in which he and colleagues looked at the relationship of Atlantic SSTs and U.S. hurricane damage. In the paper Elsner et al. make the following claim:
Using the preseason Atlantic SST, we are able to explain 13% of the variation in the logarithm of loss values exceeding $100 mn using an ordinary least squares regression model. The relationship is positive indicating that warmer Atlantic SSTs are associated with larger losses as expected. The rank correlation between the amount of loss (exceeding $100 mn) and the May-June Atlantic SST is +0.31 (P-value = 0.0086) over all years in the dataset and is +0.37 (P-value = 0.0267) over the shorter 1950–2005 period.
I’ve looked at our dataset and find nothing remotely close like these numbers. Here is my analysis for 1950-2005:
The following graph [updated 10-25-06] shows the relationship of Atlantic May-June SSTs and U.S. normalized hurricane damage (for years in which damage exceeds $100M).
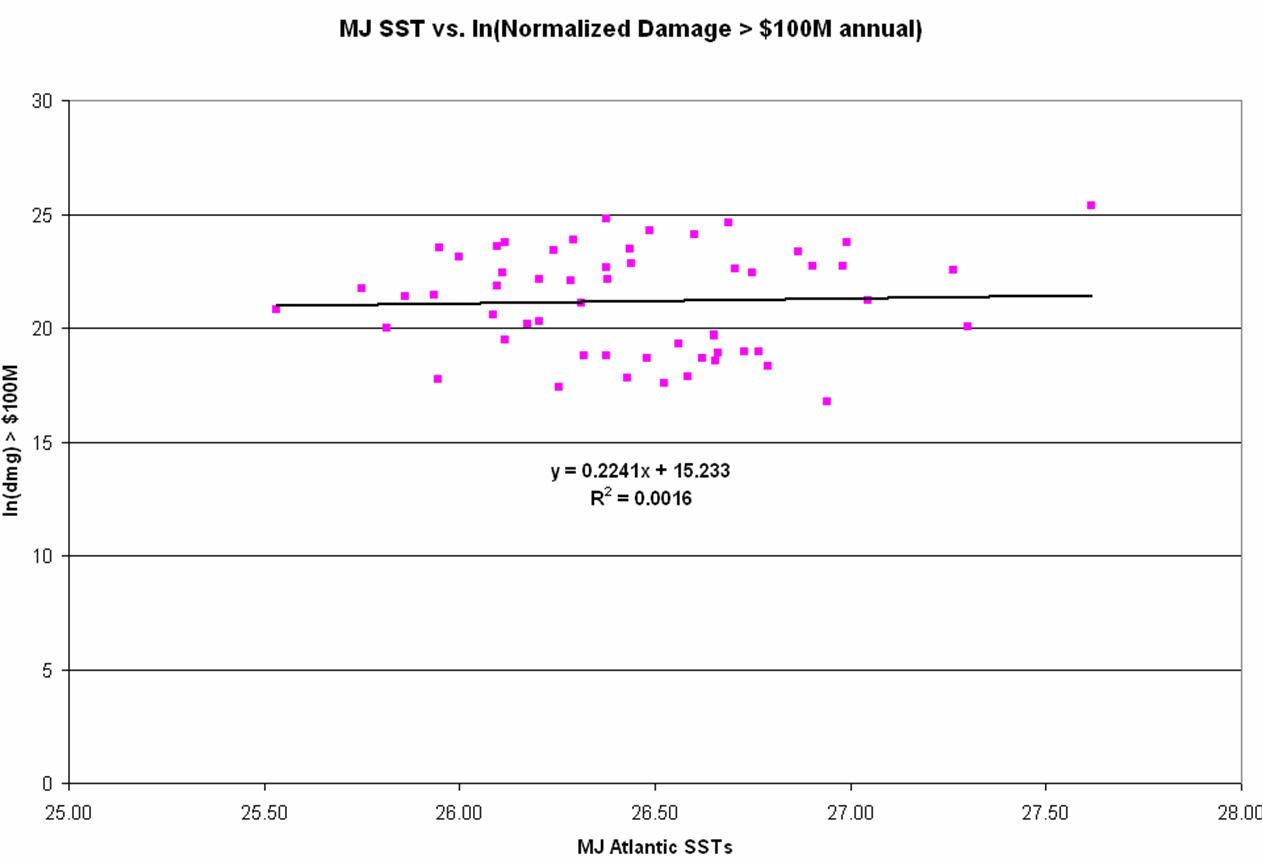
You can see from this graph there is no relationship; The rank correlation I get is -0.088. So I am curious about the reasons for the different results (leaving aside for the moment other questions). Are we using different data? To facilitate analysis, here is the data that I am using in this analysis (for all years 1950-2005, note that original NATL SST data is available here):
[UPDATED 10-25-06]
Year–MJ SST—Damage———-ln(dmg)
1950 26.11 $5,529,320,501 22.43333077
1951 26.65 $358,069,353 19.69623725
1952 26.66 $114,732,781 18.55811634
1953 26.59 $55,787,059 17.83705248
1954 26.49 $35,671,450,726 24.29761651
1955 26.29 $23,274,260,349 23.87061388
1956 26.18 $577,494,764 20.17420993
1957 26.29 $3,841,822,355 22.06921266
1958 27.30 $509,818,712 20.04956575
1959 26.09 $858,779,107 20.5710223
1960 26.60 $29,970,493,213 24.12347918
1961 26.24 $14,468,733,186 23.39525583
1962 26.79 $92,192,732 18.33939186
1963 26.56 $246,291,959 19.32202822
1964 26.44 $15,693,459,358 23.47650986
1965 26.12 $21,261,254,041 23.78015219
1966 26.65 $336,552,296 19.63426411
1967 26.21 $4,016,468,362 22.11366884
1968 26.21 $657,263,225 20.30359514
1969 26.99 $21,225,180,492 23.77845407
1970 26.75 $5,627,670,656 22.45096146
1971 25.94 $2,083,668,167 21.45739572
1972 26.10 $17,579,304,340 23.58998816
1973 26.32 $145,454,945 18.79537694
1974 25.53 $1,073,783,964 20.79445466
1975 25.75 $2,791,286,883 21.74976857
1976 25.82 $486,444,597 20.00263357
1977 26.43 $53,776,992 17.80035628
1978 26.38 $145,903,706 18.79845741
1979 26.87 $14,096,216,718 23.36917228
1980 27.05 $1,602,040,183 21.19454377
1981 26.77 $171,359,510 18.95927431
1982 26.53 $43,148,911 17.58016773
1983 26.98 $7,469,100,008 22.73404035
1984 26.12 $289,628,417 19.48410934
1985 26.00 $11,068,101,797 23.1273331
1986 25.95 $50,026,988 17.72807318
1987 26.94 $19,011,511 16.76055519
1988 26.73 $172,912,773 18.96829783
1989 25.95 $16,770,856,131 23.54290846
1990 26.62 $126,787,371 18.658022
1991 26.10 $3,044,037,453 21.83645058
1992 26.38 $57,663,865,630 24.77789657
1993 26.48 $126,479,971 18.65559452
1994 25.86 $1,938,752,062 21.38531034
1995 26.91 $7,501,957,030 22.73842976
1996 26.71 $6,537,460,457 22.60081462
1997 26.66 $163,560,186 18.91269159
1998 27.27 $6,021,601,438 22.51861908
1999 26.44 $8,277,977,785 22.83686455
2000 26.26 $36,525,742 17.41352783
2001 26.38 $6,970,450,131 22.66494564
2002 26.31 $1,491,060,293 21.12275331
2003 26.38 $4,212,081,525 22.16122279
2004 26.69 $49,130,243,738 24.61774064
2005 27.62 $107,350,000,000 25.39936036
October 24th, 2006 at 3:27 am
RTF methods section.
They use a much more sophisticated model than your plot, which is their figure 3a. This is because, as they say on page two,
“The rarity of severe hurricanes implies
that empirical estimates of return periods likely will be unreliable. Fortunately, extreme
value theory provides models for rare events and a justification for extrapolating to levels
that are much greater than have already been observed.”
October 24th, 2006 at 6:32 am
Lab Lemming- Thanks for your comments. This post focuses on the simple statistics that they report, and finds a considerable difference. I want to know why. Their 3a only shows ln(damage) over time. There is clearly no trend in the data.
Their are some questions to raise regarding the more sophisticated elements of what they’ve done, but let’s take it one step at a time;-)
Thanks!
October 24th, 2006 at 7:59 am
Hi Roger,
I reiterate. An important limitation of your analysis is the failure to disaggregate the loss data. A large annual loss can be the result of many small losses or one big loss, and the number of loss events should be independent of the magnitude of the event. Thus neither of your arguments are compelling. This logic is apriori and should be addressed before any discussions of the data.
You state in your WMO Report “Different methods exist for calculating a disaster’s impacts and result in correspondingly different estimates for the same event. Consequently extreme caution should be taken when integrating analyses or conclusions across datasets.” Yet this is exactly what you do with this new post. This has little to do with the original point from your previous point concerning which argument is most compelling.
Obviously we are using different datasets. As one example we do not include tropical storms. You have a $7bn loss for 2001 (I assume mostly from TS Allison); we have $0. Our data and sources are clearly explained in our paper.
Best,
Jim
October 24th, 2006 at 8:39 am
Jim-
Many thanks for your continued engagement. But I do find your response difficult to understand. I have presented data in the form of a simple linear regression and rank correlation — exactly as you have described in your paper — and arrived at very different results. It would be useful to understand why, no?
You do have some data issues worth mentioning:
1. You use Collins and Lowe wchich include data generated via a catastrophe model (TopCat). this raises the possibility of some circular reasoning in your analysis. In addition, a focus on insured losses includes many more “moving parts” (such as coverage, premium levels, etc.), and thus raises the probability of spurious correlations.
Question: Did you look at your results using our normalized data for total economic losses?
2. You append 2001-2005 insured loss values without any apparent adjustment to 2000 values. this “splicing” of very different datasets will be problematic unless the data is normalized (back to 2000 values).
Question: What are your results 1950-2000?
3. If you throw out storms of less than hurricane strength and also throw out storms with <$100 million in damages, then according to our dataset, you are throwing out 150 out of 219 events from 1950-2005. This is an enormous amount of relevant data. But I will examine the relationships later today based on this subset of the data as you suggest.
Question: Are your results sensitive to including either TS or <$100M events?
4. What is the physical basis for MJ SSTs to influence intra-seasonal damage?
5. How about this — if you would simply share your data, as I have, I’d be happy to do these comparisons. Unfortunately, your paper does not provide the data or access to it. Explaining the differences in our analyses should be quite easy once I have your dataset. We are talking about approximately 80 events 1950-2005 plus the SST data that you used. You can send it to me by email if you’d prefer not to post.
Thanks!
October 24th, 2006 at 9:32 am
Jim- A further comment …
You appear to use detrended SST data in your study. Setting aside everything else for the moment, presumably the SST trend is the most direct manifestation of anthropogenic climate change (a poitn that I think you made in GRL). If your damage study is based on data that has removed this trend, then why is it relevant to a discussion of the role of anthropogenic factors in US hurricane damage?
(Note – I understand and appreicate your point about “random sums” — this is a different issue.)
Thanks!
October 24th, 2006 at 10:36 am
Hi Roger,
I probably shouldn’t do this (read and comment during a lunch hour, on something that I’m not familiar with), but…
You write, “But I do find your response difficult to understand. I have presented data in the form of a simple linear regression and rank correlation — exactly as you have described in your paper — and arrived at very different results. It would be useful to understand why, no?”
I think one of Jim Elsner’s points is that one could (or even should?) treat each event as separate prior to doing the linear regression. You’re adding all the damage in one year together before doing your regression, right? If so, would you get a different answer from not adding all the damage in one year together…i.e., using a separate data point for each storm?
October 24th, 2006 at 12:30 pm
The issue under discussion is well outside my areas of expertise, so kindly allow me to ask a question and make a few comments.
What physical mechanisms/processes can there be to cause hurricane damage to be related to SST. The damage caused is primarily a function of the type, quality, and quatity of the structures and things in the path of the hurricane. This is shown by the fact that some hurricanes cause no damage.
It seems to me that a proper measure of the potential, or driving force, for damage is the power of the storm. Direct correlation of damage as a function of SST does not seem to be correct in either the engineering or the scientific sense. A proper measure of the potential would not allow the cases in which no damage is done under positive values of the measure of the potential. I also would expect it to be a monotonic function of the potential. In adition to also being a proper function in a mathematical sense.
Additionally, how are allowances made for indirect effects of the hurricane in contrast to direct effects? New Orleans comes to mind as an indirect effect due to failure of the 350 year long efforts to build engineering-solution-level levee systems.
October 24th, 2006 at 3:22 pm
Hi Dan,
You write, “New Orleans comes to mind as an indirect effect due to failure of the 350 year long efforts to build engineering-solution-level levee systems.”
I think New Orleans is the direct result of failure to have developed and deployed a $2 billion (or less) water-filled-tube storm surge protection system from Pascagoula, MS, to south of Point a la Heche, LA, running along the Chandeleur Islands.
I’m pretty sure such a system could be deployed in less than 48 hours, at a cost of less than $2 billion…and it would have completely blocked the storm surge that caused New Orleans to flood.

http://markbahner.typepad.com/random_thoughts/2006/08/some_responses_.html
But I agree with your general point…the damages were not so much “direct” as “indirect” (resulting from failure of protection measures).
Mark
October 25th, 2006 at 3:33 am
Roger,
Could you please assist me with this:
How do you derive these SSTs (e.g. 26.11°C for 2005) from the dataset at http://www.cpc.noaa.gov/data/indices/sstoi.atl.indices ?
Thanks
October 25th, 2006 at 7:32 am
Wolfgang- Thanks very much for your close attention. The years were out of order with respect to SSTs (apparently an incomplete sort on my part). Sorry about that. I’ve reposted the data from the spreadsheet that generated the figure.
1950 MJ SSTs are 26.11
This is calculated from:
http://www.cpc.noaa.gov/data/indices/sstoi.atl.indices
May is 25.85
June is 26.37
Average of the two is 26.11
Apologies for the confusion! Data is now correct.
October 25th, 2006 at 8:54 pm
Playing catch-up again; my apologies. On the other hand, I’m only doing this because the World Series is rained out. (A pox on anyone who says this is due to climate change!)
I would prefer to use event-specific data: damage and SST values for each storm. It’s a mistake to count individual damages within storms as separate events. They aren’t independent. But averaging over a year’s time dulls a true model’s ability to detect a real effect.