How to Make Two Decades of Cooling Consistent with Warming
May 12th, 2008Posted by: Roger Pielke, Jr.
The folks at Real Climate have produced a very interesting analysis that provides some useful information for the task of framing a falsification exercise on IPCC predictions of global surface temperature changes. The exercise also provides some insight into how this branch of the climate science community defines the concept of consistency between models and observations, and why it is that every observation seems to be, in their eyes, “consistent with” model predictions. This post explains why Real Climate is wrong in their conclusions on falsification and the why it is that two decades of cooling can be defined as “consistent with” predictions of warming.
In their post, RealClimate concludes:
Claims that a negative observed trend over the last 8 years would be inconsistent with the models cannot be supported. Similar claims that the IPCC projection of about 0.2ºC/dec over the next few decades would be falsified with such an observation are equally bogus.
Real Climate defines observations to be “consistent with” the models to mean that an observation, with its corresponding uncertainty range, overlaps with the spread of the entire ensemble of model realizations. This is the exact same definition of “consistent with” that I have criticized here on many occasions. Why? Because it means that the greater the uncertainty in modeling — that is, the greater the spread in outcomes across model realizations — the more likely that observations will be “consistent with” the models. More models, more outcomes, greater consistency – but less certainty. It is in this way that pretty much any observation becomes “consistent with” the models.
As we will see below, the assertion by Real Climate that “a negative observed trend over the last 8 years would be inconsistent with the models cannot be supported” is simply wrong. Real Climate is more on the mark when they write:
Over a twenty year period, you would be on stronger ground in arguing that a negative trend would be outside the 95% confidence limits of the expected trend (the one model run in the above ensemble suggests that would only happen ~2% of the time).
Most people seeking to examine the consistency between models and observations would use some sort of probabilistic threshold, like a 95% confidence interval, which would in this case be calculated as a joint probability of observations and models.
So let’s go through the exercise of comparing modeled and observed trends to illustrate why Real Climate is wrong, or more generously, has adopted a definition of “consistent with” that is so broad as to be meaningless in practice.
First the observations. Thanks to Lucia Liljegren we have the observed trends in global surface temperature 2001-present (which slightly less than 8 years), with 95% confidence intervals, for five groups that keep such record. Here is that information she has presented in degrees Celsius per decade:
UKMET -1.3 +/- 1.8
NOAA 0.0 +/- 1.6
RSS -1.5 +/- 2.2
UAH -0.9 +/- 2.8
GISS 0.2 +/- 2.1
Real Climate very usefully presents 8-year trends for 55 model realizations in a figure that is reproduced below. I have annotated the graph by showing the 95% range for the model realizations, which corresponds to excluding the most extreme 3 model realization on either end of the distribution (2.75 to be exact). (I have emailed Gavin Schmidt asking for the data, which would enable a bit more precision. ) The blue horizontal line at the bottom labeled “95% spread across model realizations” shows the 95% range of 8-year trends present across the IPCC model realizations.
I have also annotated the figure to show in purple the 8+ year trends from the five groups that track global surface temperatures, with the 95% range as calculated by Lucia Liljegren. I have presented each of the individual ranges for the 5 groups, and then with a single purple horizontal line the range across the five observational groups.
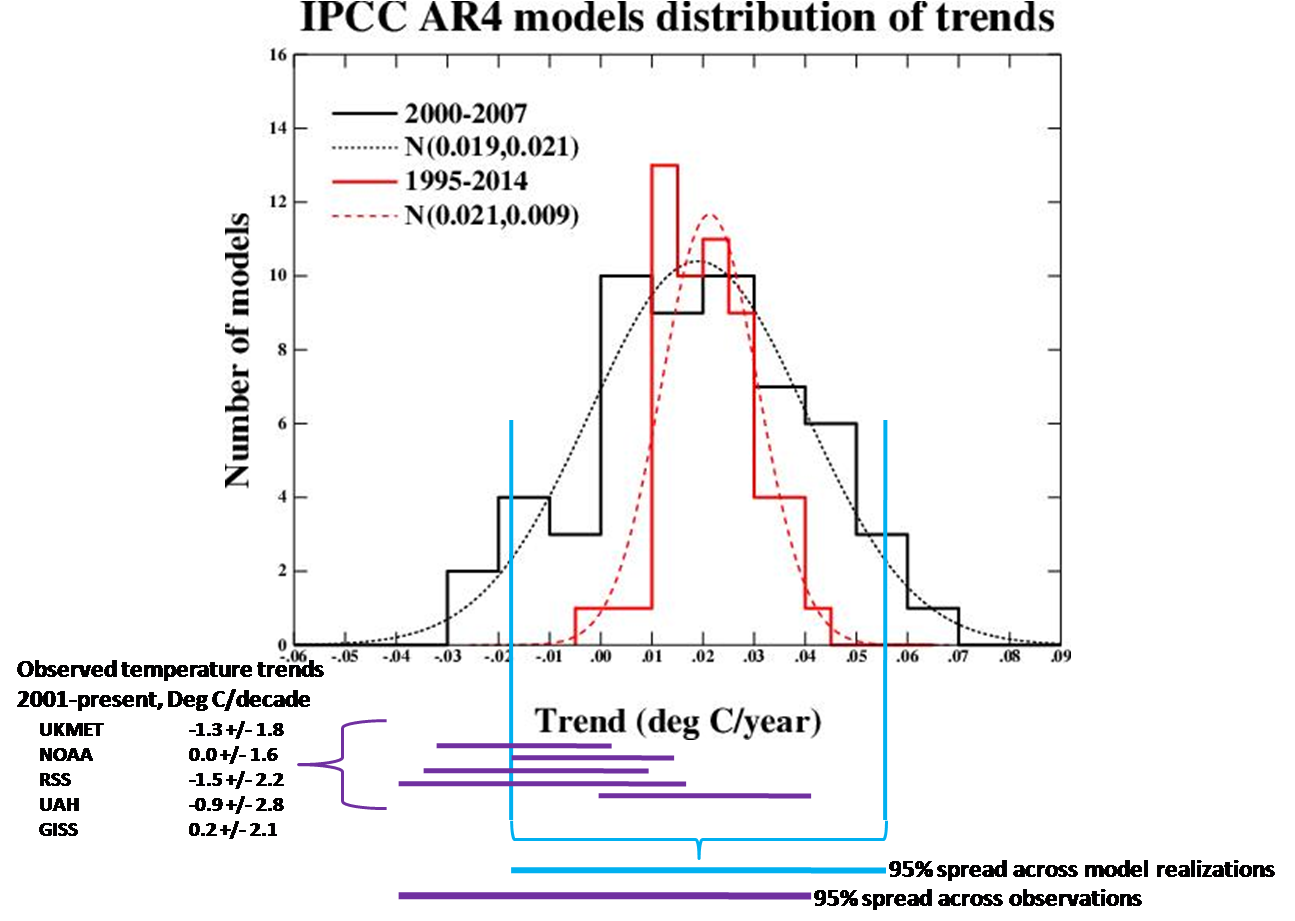
Quite clearly there is a large portion of the spread in the observations that is not encompassed by the spread in the models. This part of the observations is cooler than the range provided by the models. And this then leads us to the question of how to interpret the lack of complete overlap.
One interpretation, and the one that makes the most sense to me, is that because there is not an overlap between modeled and observed trends at the 95% level (which is fairly obvious from the figure, but could be easily calculated with the original data) then one could properly claim that the surface temperature observations 2001-present fail to demonstrate consistency with the models of IPCC AR4 at the 95% level. They do however show consistency at some lower level of confidence. Taking each observational dataset independently, one would conclude that UKMET, RSS, and UAH are inconsistent with the models, whereas NASA and NOAA are consistent with them, again at a 95% threshold.
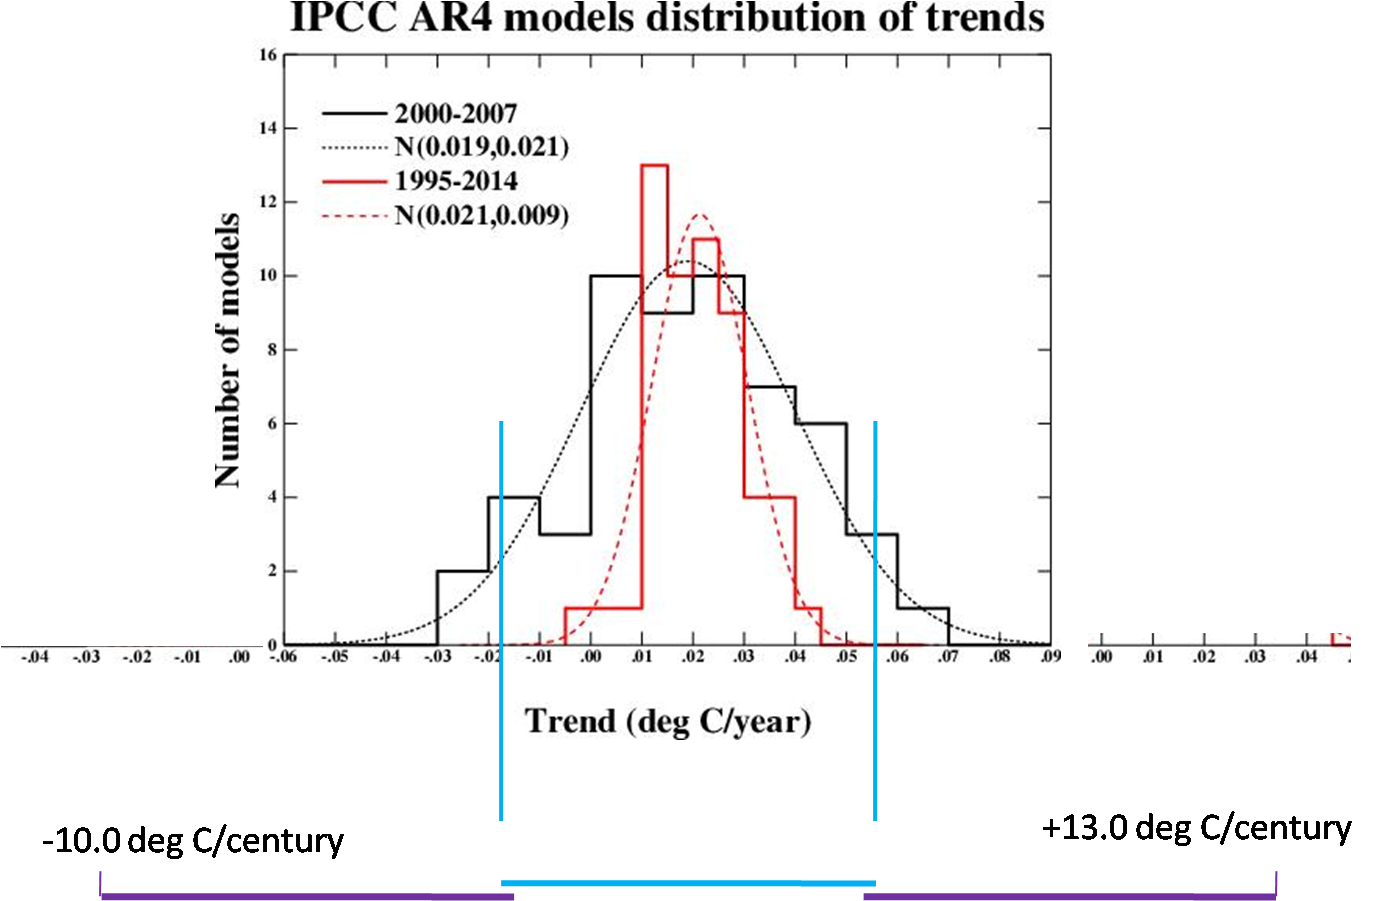
Another interpretation, apparently favored by the guys at Real Climate, is that because there is some overlap between the 95% ranges (i.e., overlap between the blue and purple lines), the models and observations are in fact consistent with one another. [UPDATE: Gave Schmidt at RC confirms this interpretation when he writes in response to a question about the possibility of falsifying IPCC predictions: "Sure. Data that falls unambiguously outside it [i.e., the model range].”] But this type of test for consistency is extremely weak. The Figure below takes the 95% spread in the observations and illustrates how far above and below the 95% spread in the models some overlap would allow. If the test of “consistent with” is defined as any overlap between models and observations, then any rate of cooling or warming between -10 deg C/decade and +13.0 dec C/decade could be said to be “consistent with” the model predictions of the IPCC. This is clearly so absurd as to be meaningless.
So when Real Climate concludes that . . .
Claims that a negative observed trend over the last 8 years would be inconsistent with the models cannot be supported
. . . they are simply incorrect by any reasonable definition of consistency based on probabilistic reasoning. Such claims do in fact have ample support.
If they wish to assert than any overlap between uncertainties in observed temperature trends and the spread of model realizations over an 8-year period implies consistency, then they are arguing that any 8-year trend between -10/C and +13/C (per century) would be consistent with the models. This sort of reasoning turns climate model falsification into a rather meaningless exercise. [UPDATE: In the comments, climate modeler James Annan makes exactly this argument, but goes even further: "even if the model and obs ranges didn't overlap at all, they might (just) be consistent".
Of course in practice the tactical response to claims that observations falsify model predictions will be to argue for expanding the range of realizations in the models, and arguing for reducing the range of uncertainties in the observations. This is one reason why debates over the predictions of climate models devolve into philosophical discussions about how to treat uncertainties.
Finally, how then should we interpret Keenlyside et al.? It is, as Real Climate admits, outside the 95% range of the IPCC AR4 models for its prediction of trends to 2015. But wait, Keelyside et al. in fact use one of the models of the IPCC AR4 runs, and thus this fact could be used to argue that the range of possible 20-year trends is actually larger than that presented by the IPCC. If interpreted in this way, then this would get us back to the interesting conclusion that more models, initialized in different ways, actually work to expand the range of possible futures. Thus we should not be surprised to see Real Climate conclude
Similar claims that the IPCC projection of about 0.2ºC/dec over the next few decades would be falsified with such an observation [of "a negative observed trend"] are equally bogus.
And this gentle readers is exactly why I explained in a recent post that Keelyside et al. now means that a two-decade cooling trend (in RC parlance, a “negative observed trend over 20 years”) is now defined as consistent with predictions of warming.
May 12th, 2008 at 2:23 pm
So, If we run the models with all possible (no matter how improbable) initial conditions then all observed temperatures whether cooling or warming are consistent with our predictions of global warming. Sounds like Tacoma reasoning to me, I in no way want to drive, walk or be near a bridge built Gavin and company.
May 12th, 2008 at 7:03 pm
There is really no doubt that natural variability will exceed the predicted CO2 warming trend – even the Playstation climatologists will now admit that. One thing the recent record shows is that the expected trend – 1 deg C per doubling of CO2 concentration, is insignificant.
The “bottom line” is that this is not worth an alarm, so to speak. We have plenty of time to figure out what’s going on with the multitude of factors effecting climate change, so we don’t need to hobble civilization – especially not for the benefit of a privileged few carbon traders.
We do need, to be sure, to vastly increase the computational resources available to climate scientists, but as the population is now beginning to put into context: cooling is worse than warming.
May 12th, 2008 at 7:22 pm
“One interpretation, and the one that makes the most sense to me, is that because there is not an overlap between modeled and observed trends at the 95% level (which is fairly obvious from the figure, but could be easily calculated with the original data) then one could properly claim that the surface temperature observations 2001-present fail to demonstrate consistency with the models of IPCC AR4 at the 95% level.”
Roger, can you explain what you mean by this? It seem quite clear to me from your own figure that the model ensemble is consistent with all the observational analyses. That is, all of the observed trends (means) lie well within the 95% range of the models.
May 12th, 2008 at 8:14 pm
James-
I am comparing the 95% range of the observations with the 95% range of the models, and not means with means, or means with uncertainty ranges.
You are correct that the observational trends, without at all considering uncertainty, are within the range of the models, when considering uncertainty in the models.
But as you know, 8 year trends have a wide uncertainty range, so it is proper to compare the uncertainty ranges in each. These ranges are shown in the figure above with the horizontal lines at the bottom for models (blue) and observations (purple) as well as for each of the observational analyses.
For a discussion of the methodology used by Lucia Liljegren to compute the 95% level uncertainty ranges in the 8-year observational trends, see:
http://rankexploits.com/musings/2008/correcting-for-serial-autocorrelation-cochrane-orcutt/
May 12th, 2008 at 8:16 pm
James- Also, here is Real Climate on this same principle:
“If a model-data comparison is done, it has to account for the uncertainty ranges – both in the data (that was Lesson 1 re noisy data) and in the model (that’s Lesson 2).”
http://www.realclimate.org/index.php/archives/2008/04/model-data-comparison-lesson-2/
We’ve learned our lessons well;-)
May 12th, 2008 at 8:29 pm
The maximum rate of fall out of the Eemian would not be “inconsistent” with projected “global warming” over a few decades…
http://www.gcrio.org/CONSEQUENCES/winter96/article1-fig3.html
May 12th, 2008 at 8:42 pm
Roger,
“I am comparing the 95% range of the observations with the 95% range of the models, and not means with means, or means with uncertainty ranges.”
Let me just make sure I’ve got this straight. You are saying that because the 95% range of the models and the 95% range of the obs disagree, they are inconsistent?
If this is not what you mean, please clarify more precisely.
May 12th, 2008 at 8:54 pm
James – you have to define “inconsistent”. Two standard deviations?
Is not being skeptical of trends what this is all about?
Of course, as there is really no standard deviation realistically assignable to models, nothing is inconsistent.
May 12th, 2008 at 9:01 pm
James-
When comparing two distributions, the question of consistent or inconsistent requires some threshold be established defining “consistency”.
One might argue that any overlap of model range and observation range demonstrates consistency,or 50% overlap, or 95% overlap (or whatever). But this threshold must be specified.
From the figure it is clear that some rather large portion of the 95% range of the observations lies completely outside the 95% ranges of the models. How large? Gavin never sent me the data, so I didn’t compute it but it looks like the overlap is about 2/3s of the range (???) across all of the observations — whatever it is, it is certainly not 95%.
More precisely, the NASA and NOAA trends with uncertainties fall 100% within the model uncertainty range, whereas a pretty large part of the UKMET, UAH, and RSS trends lie outside of this same range.
So I have concluded that there is in fact a solid quantitative basis for asserting that the models and observations 2001-2008 are not consistent, contrary to the claim at RC. To argue that they are consistent would require a pretty generous (i.e., small) threshold of overlap.
Does this clarify?
May 12th, 2008 at 9:20 pm
With all these statistics flying around, why stop here?
If you have i) 95% confidence intervals for the experimentally observed cooling trends; ii) 95% confidence intervals for the ensemble of model predictions; and iii) you are willing to assume that these two variables are both normally distributed, it is easy to calculate the probability that the “true” experimental mean temperature trend and the “true” model-predicted mean temperature trend are the same.
Doing this test of statistical hypotheses would attach a quantitative result to the question of how much the models are “consistent with” the data.
Quantitative results are good.
May 12th, 2008 at 9:26 pm
Curt- Amen.
May 12th, 2008 at 9:56 pm
Roger,
I’m having trouble believing what I am reading, which is why I am pressing you for more clarity.
The threshold for consistency isn’t the issue – you have repeatedly used 95% and I have no complaint with that. So let’s get back to the substantive issue.
Are you seriously asserting that because the uncertainty ranges have incomplete overlap, that the obs and model are inconsistent?
May 12th, 2008 at 10:02 pm
James-
A 95% overlap is incomplete, no? (With a complete overlap being 100%) So, no, being incomplete is not the issue, it is the degree of incompleteness that matters.
Why don’t you just explain your point directly. What degree of overlap would you associate with “consistency”?
May 12th, 2008 at 10:23 pm
My point is that *obviously* if the observed value lies in the uncertainty range of the models, then the two are consistent (at that given level of confidence). Even if the observed value lies *outside* the model range then it may still be consistent, depending on how far outside it is and what the observational uncertainty is. In that case, a calculation would be required. But with the data as presented in your graph, this is a non-issue.
This may help a little:
http://en.wikipedia.org/wiki/Confidence_interval
and note the quote “[i]t is a common statistical misconception to suppose that two quantities whose 95% confidence intervals just fail to overlap are significantly different at the 5% level” which is attributed to Goldstein, H., & Healey, M.J.R. (1995). “The graphical presentation of a collection of means.” Journal of the Royal Statistical Society, 158, 175-77.
Just to reiterate: even if the model and obs ranges didn’t overlap at all, they might (just) be consistent. But given that the obs mean (in all cases) is well within the model range, the consistency is trivial and immediate.
May 13th, 2008 at 6:29 am
“Why? Because it means that the greater the uncertainty in modeling — that is, the greater the spread in outcomes across model realizations — the more likely that observations will be “consistent with” the models. More models, more outcomes, greater consistency – but less certainty”
I think this is a specific example of Popper’s contention that the most informative theories are the least probable, in the sense that they make many specific predictions and are therefore readily falsifiable. The theory that is a climate model (so far) is at the opposite end of the spectrum.
May 13th, 2008 at 6:40 am
James-
You seem to miss the fact that we are talking about trends in a short dataset. (Remember trends with trends). Trends have uncertainties, and taking only means ignores those uncertainties.
Consider the opposite case — if we focused on the model means only, and pointed out that the 8-year model mean of 0.2/decade lies completely out side the uncertainty ranges of 4 of 5 observational datasets with 95% ranges considered, I could equally make the claim that inconsistency is trivial and immediate (indeed this is the analysis that L. Liljegren has provided).
I am not surprised that, as a modeler, you are happy to consider the widest possible perspective on model uncertainties, while discounting the same in observational uncertainties. You are demonstrating exactly the response that I wrote of in the post: “Of course in practice the tactical response to claims that observations falsify model predictions will be to argue for expanding the range of realizations in the models, and arguing for reducing the range of uncertainties in the observations.”
Finally, you write incredibly, “even if the model and obs ranges didn’t overlap at all, they might (just) be consistent” — this is equivalent to saying that any observed8-year trend of -10 c/decade to 13 C/decade is consistent with the IPCC AR4 models. Sorry, I reject this as far too loose a standard by which to evaluate model predictions. It is exactly this sort of logic which leads to any possible observation being consistent with the models.
May 13th, 2008 at 6:43 am
“Why? Because it means that the greater the uncertainty in modeling — that is, the greater the spread in outcomes across model realizations — the more likely that observations will be “consistent with” the models. More models, more outcomes, greater consistency – but less certainty”
I think this is a specific example of Popper’s contention that the most informative theories are the least probable, in the sense that they make many specific predictions and are therefore readily falsifiable. The theory that is a climate model (so far) is at the opposite end of the spectrum.
May 13th, 2008 at 6:57 am
I suspect IPCC models will never be falsified according to the back-slappers and high-fivers at Realclimate because they will continually tweek their models to reflect what has really occured. So there will never be any long-term deviation from projection.
Science truly has sunk to a new low.
May 13th, 2008 at 7:12 am
My gut reaction to all this is that eight years is just too short a period to be talking about a climate trend. The fact that the different “global” data sets are not in agreement is an automatic red flag. The modelers are wise to continue to emphasize the 20th century warming trend rather than “tinker” to try and capture something which may be an artifact of the measuring methods, compilations, etc….
May 13th, 2008 at 9:45 am
“This is one reason why debates over the predictions of climate models devolve into philosophical discussions about how to treat uncertainties.”
And that tells the entire story, really. If the models were correct in their predictions, if off a bit in magnitude but otherwise correct, the debates wouldn’t so devolve. The warming would be as plain as the nose on my face and it would, in fact, be global. That this debate even exists is clear evidence that the data aren’t “consistent” with the models. When ones must resort to semantical gymnastics to validate a claim, the game is already over.
May 13th, 2008 at 12:28 pm
Roger:
The differences between Koutsyiannis et al. and the IPCC that you have excerpted are probably due to ‘errors’ in experimental design.
Your differences with Gavin Schmidt, on issues of “consistency”, may be ‘merely’ semantic.
I’d like to address these problems consecutively:
PROBLEM ONE
Often, one tries to design an experiment to ‘test’ a theory by developing a model in which some number of variables of the theory are matched, in the experiment, by a (manageably small) number of empirical measurements. The design tries to include sufficient NUMBERS of measurements so that the VARIATIONS among them, about the average value, will be able to be computed (using some model, such as the Central Limits Theorem) within some desired level of confidence. But for the design, and those calculations, to be at all useful, the measurements must be REPRESENTATIVE and unbiased, or must match known biases in the theory quite closely, otherwise, any calculated confidence interval may be meaningless. Thus, for a ‘scientific’ poll of voters to be useful for predicting the outcome of an election, the poll-sample demographics have to ‘match’ those of the voting population (with respect to relative frequencies of voter gender, age, race, economics, education, party affiliation, etc.). This may be achieved either by a VERY large random sample, or a much smaller sample, carefully matched to the population demographics.
Global Climate Models (GCMs) all use similar approximations of the same classical mechanics, hydrodynamics, thermodynamics, geography, albedo and solar insolation to model the climate of the Earth. However, (usually small) differences in those approximations and in their boundary conditions and resolutions, are responsible for differences in their outputs. Stochastic variations in output are ‘smoothed out’ and average values more confidently predicted, the longer the integrating time and the larger the fraction of the Earth used.
Thus, for any particular integration time, predictions of a local climate parameter will generally yeild much lower confidence, compared to global climate parameter. But there is also a much more serious ‘demographics’ problem, which was neglected in the Koutsoyiannis et al. study.
All GCMs produce grossly similar large-scale circulations such as the Hadley Circulation, the Walker circulation and the movements of the ITCZ. Those circulations are characterized by some regions which are relative uniform and ‘boundary regions’ where circulations vary rapidly and non-linearly in space and time. It is the locations of the latter, that therefore show the largest differences between different models, and between models and observation. Other regional phenomena, like the El Niño Southern Oscillation (ENSO) and the Multi-decadal Atlantic Oscillation (MAO), that are relatively poorly understood and therefore poorly modeled by the GCMs, have stronger effects on some regions than on others.
To fairly test the ‘consistency’ of GCMs, if only small numbers of local climates are to be studied, those geographical locations should be chosen to avoid the ‘boundary regions’ and those regions most sensitive to phenomena like the the ENSO and MAO. This problem is not discussed
by Koutsoyiannis et al., and their choices are poor, by this criterion. It is not unlike polling only 1,000 white, middle-aged, New York women to try to predict whether the Democrats will nominate Barack Obama.
PROBLEM TWO
Deductive reasoning (of formal language, logic, math and theoretical science) is characterized by sets of agreed upon axioms and definitions which can be used to formulate conjectures that are decidable (absolutely true or absolutely false; provable theorems or falsifiable) or undecidable [probably either true or false, but incomplete (sometimes Gödelian, but more frequently Humean) with respect to agreed upon axioms and definitions].
Inductive reasoning (of experimental science and everyday experience) is characterized by in-principle, undecidable ‘facts’ that can never be proved to be either absolutely true or absolutely false, because their definitions must always be incomplete. Facts are always extrapolations or interpolations from observations of only a sample of external reality. As Hume taught, there is no way to deductively GUARANTEE that a sample that has so far been observed is PERFECTLY REPRESENTATIVE of yet-to-be, sampled parts of the whole. So we use ‘preponderance of the evidence’, (and in science, this is now typically measured with calculations of confidence intervals), to deal with this fuzzy kind of ‘truth’.
All scientific ‘truth’ is to some degree uncertain and fuzzy. Karl Popper’s (absolute) “falsifiability” can only have meaning for theoretical models; it can’t exist, and has no meaning for the facts of experimental science.
For scientific predictions, “consistent with” and “inconsistent with” now replace falsifiability in discussing scientific ‘truth’ and can only mean “within or outside of some confidence interval”. Until two parties agree to the same definition of a particular confidence interval, there’s no basis for resolution of a dispute about consistency. Experiments can usually be modified to accomodate newly revealed variables, to try to improve the fit between new data and a model to increase confidence. So long as “over-fitting” is avoided, this is a reasonable strategy.
It appears that this may be the root of most of the differences between you and Gavin Schmidt of GISS and Real Climate.
Len Ornstein
May 13th, 2008 at 2:26 pm
“Until two parties agree to the same definition of a particular confidence interval, there’s no basis for resolution of a dispute about consistency.”
Len, I believe this is the stage we are at. We are trying to get anyone to commit to a particular confidence interval. At May 12, 2008 09:01 PM, Roger suggested 50% as a starting point for discussion since the actual confidence intervals for each data set cannot be calculated without the data. No one has yet discussed the merits of that 50% nor suggested some other number. — John M Reynolds
May 13th, 2008 at 2:28 pm
A couple of points on this discussion:
The idea that the surface observations have an equal spread either side of the given number is likely untrue. There is a very high probability that the surface numbers have a warm bias due to land use changes, population growth and other anamolies over the last 100 years. Therefore, the potential error on the positive side should be smaller, while the error on the negative side should be larger. This would bring GISS and NOAA more in line with the other data sets and make ALL data sets relatively inconsistent with the models.
Secondly, I actually understand James Annan’s argument from a scientific/clinical stand point. It is, however, a bit like claiming that the maiden voyage of the Titanic was consistent with safe boating, because some passengers arrived unharmed at their destination. For those passengers, the claim is ‘technically’ true, but few in the real world would have the audacity to make that claim. Such claims are meaningless when applied to procedures, policies and decision making.
Therein lies the rub. The climate models are not some esoteric scientific dalliance without any impact on the rest of society. The models remain the sole argument for an impending climate crisis. The models remain the sole argument for reducing the well-being of the vast majority of humans on the planet. This reduction is already taking place, and is most obvious in the misguided attempt to burn food for fuel. The unintended consequences of this silly idea continue to domino across the face of the planet. And this is just the tip of the iceberg of the havoc that could be unleashed in the name of an impending climate crisis.
To politicians and the public, the term ‘consistent with’ is an indication that the models have skill at modeling climate and, therefore, predicting a future climate crisis. Certainly those making the ‘consistent with’ claims are aware of this and have the responsibility to clarify that such broad definitions of consistency do not indicate any significant level of skill. Otherwise, they are misleading the decision makers and are culpable for the damage done.
May 13th, 2008 at 4:30 pm
Roger,
It is nothing to do with “perspective”. It is just elementary statistics. If you have some new definition of “consistent with” then please explain it, and please show your working that shows that these obs are not consistent with the model ensemble.
I don’t really see how to present this in any simple way. The models say that a 7-year trend will be a sample from N(0.02,0.02) (per year), and the obs are all something like -0.01, which is clearly INSIDE the 95% range of the model ensemble.
How can you really not see something as utterly trivial as this? Your stubborn refusal to admit the bleeding obvious makes it very hard for me to take anything else you say seriously.
Can you tell me what observed value you would be prepared to admit as being consistent with the models? Again, I ask you to show your working here.
May 13th, 2008 at 5:04 pm
James-
No need to get all worked up.
Is it safe to say that you think that the uncertainty in the 8-year trends in the observations is irrelevant to this discussion? Since you keeping ignoring it by focusing on the means, I am assuming that you do.
I will repeat myself that consistency is not a black/white issue. Every paired distribution of observations and model realizations that has some degree over overlap can be said to have consistency at some level of certainty. So, for example, it looks to me that the observations from GISS are very highly consistent with the models, whereas RSS is much less consistent. Surely you’d agree with this conclusion.
But even taking your focus solely on the means in the observed trends, the RSS, UAH, and UKMET measures are very close to or even outside of the 95% range (I can’t tell exactly without the data from Gavin). Either way, a large part of the 95% interval for these observed trends lies outside the 95% interval for the models. This can be seen in the figure 1 that I showed. This means that there is a not insignificant probability that the actual trends lie outside the 95% model uncertainty. And on this basis one would certainly be justified in saying that the models and observations are not consistent, at some level of certainty.
Now, you are perfectly free to define “consistency” between models and observations in a manner that ignores uncertainty in the observations. And as I already stated, someone else can define it the opposite way by considering uncertainty in observations, but only the model means. Each approach is selective and will result in opposite conclusions.
I prefer to follow the advice of the late Allen Murphy (world’s expert of forecast verification) who strongly advised looking at uncertainties in both observations and models 9On this RC and I agree 100%). When one does so in this situation, there is a clear area when these distributions do not overlap, as shown in the figure above.
Surely you can admit this much.
Now whether or not this area of lack of overlap demonstrates “inconsistency” gets us very much into a philosophical discussion akin to discussions of “significance”. I have claimed that there are solid grounds for claiming a lack of consistency, Real Climate has said their are no such grounds. Readers can look at the numbers and decide for themselves using whatever thresholds they chose to impose on the relationship.
But let me repeat, if you assert that distributions that demonstrate no overlap can still be claimed to be consistent at any meaningful level (e.g., 95%), then I am afraid that you have illustrated quite clearly how it is that this perspective on model-data agreement leads one to find that virtually every possible observation can be claimed to be “consistent with” the models, as I show in my figure 2.
May 13th, 2008 at 5:10 pm
Roger,
I’ve asked you several times now to support your claims with a calculation. How do you define “consistent”, and how do you calculate it?
May 13th, 2008 at 5:24 pm
James-
Consistency is defined as the degree over overlap between a distribution of forecasts and observations.
I am confident that you know how to quantitatively evaluate the degree of correspondence of two distributions;-) but if you (or anyone else) wants a good primer on the various dimensions of forecast verification, and how they are calculated, see this paper by Murphy:
http://ams.allenpress.com/archive/1520-0434/8/2/pdf/i1520-0434-8-2-281.pdf
Can you now address the points raised in my previous response? Or do you only ask questions?
May 13th, 2008 at 7:01 pm
Roger,
I’ve already told you that the answer is (trivially) that they are consistent, because the observation is inside the forecast range (even ignoring the observational uncertainty). I’m still puzzled as to what calculation you can perform to show otherwise, and you have still not presented any, despite my repeated requests.
If your claim is really that the observations are inconsistent with the models simply because the observational *uncertainty* extends to values that are not covered by the models, then you are wrong. Very wrong. This would mean that all models (even perfect ones!) are always falsified by sufficiently inaccurate observations. I hope it is immediately intuitively clear to you that this must be nonsense, even if you do not understand the statistics behind it.
Perhaps the source of your confusion is that the observed uncertainties are not as you have stated the “distribution of observations”, but rather the uncertainty range on a single value. These two concepts are completely different. There is only one realisation here! There are no realisations outside the model range!
Yes, the immediate conclusion is that the models are consistent with a wide range of observed trends over a short enough interval. This is why no-one outside of the denialist community finds the question very interesting. I’ve already presented explicit calculations looking at a 30-year interval, which you have tried your best to ignore. These calculations exclude negative trends (and small positive ones) with high confidence.
BTW you appear to have dropped an order of magnitude in your -10 to +13 calculation. But hey, maybe that is just a matter of “perspective” too.
May 13th, 2008 at 9:03 pm
James-
“This would mean that all models (even perfect ones!) are always falsified by sufficiently inaccurate observations”
Consider the following very simple example.
If I ask you for a prediction of how many whales inhabit the ocean, and you devise some method and tell me that the number is 1000 +/- 100. Then we go and count the number we can find and our observations show 901 +/- 50. It seems fairly obvious that there is a nonzero probability that the true number of whales falls outside the predicted range. This conclusion would not change if the observations were 901 +/- 500 or 901 +/- 5.
It is not the magnitude of the uncertainty, simply the possibility that the true observational value lies outside the modeled range.
There is indeed a meaningful difference between a comparing a prediction of 1000 +/- 100 with (a) observations of 990 +/- 50 and (b) observations of 901 +/- 50. In case (a) there are no parts of observational range that falls outside of the predicted range. In case (b) almost half of the observational range falls out side of the modeled range.
The fact that you stubbornly refuse to admit that there is any meaningful difference between (a) and (b) is surprising. It seems a fairly obvious point.
But instead of making the same point over and over, which I’ve acknowledged and disagree with, why don’t you present us with the proper way to construct a test of consistency using the information provided by Real Climate on the model range?
In other words, what hypothetical observations would be inconsistent with this range over the 8-year period? Please provide numbers.
May 13th, 2008 at 9:05 pm
James- Good catch on the decimal point, now fixed, thanks!
May 13th, 2008 at 10:14 pm
Roger,
You are *still* not telling me what calculation you would perform. Are you unable to do so? If you claim that 901+-50 is inconsistent with 1000+-100 then your use of the term is certainly incompatible with the entirety of the statistics literature, in which it is used to test the null hypothesis that the sample was drawn from the predicted distribution. Eg see Chapter 5 of Wilks “Statistical methods in the atmospheric sciences”, and in particular 5.1.3 “The elements of any hypothesis test”. I assure you this is no sneaky trick of “perspective” and it is nothing unique to climate science, it is simply the way statistics has worked for decades, perhaps centuries, and I am honestly shocked that you don’t seem to understand it. Indeed even Wilks doesn’t cover the basics in great detail because it is below the level of his book.
Given your repeated refusal, or inability, to explain what *you* mean by the term “inconsistent”, I don’t think I have anything more to add. I can’t be bothered doing a precise calculation on 8 year trends, but obviously an observed trend inside the 95% range of the models will certainly be consistent at the 95% level, and some *modest* distance outside will also be consistent once one takes account of observational error. This latter effect will be rather small and may be ignorable in practice, but calculating it accurately would require more effort than I’m prepared to go to. Gavin’s answer (ie your picture above) is already good enough, and shows that consistency over such a short interval is a pretty meaningless test, but one that the models pass easily enough.
May 13th, 2008 at 10:27 pm
If I predict 1000 +/- 100 whales and the count is 901 +/-500, all I know is that my observations cannot confirm my model. I can’t make any claim about the model itself–except that observations do not falsify it.
This is akin to what is happening now. The possible observed trends are so large that they cannot be used to confirm–or especially to disconfirm–the models. The reason they are so large is because they are so short. And we are back to square one, aren’t we?
(BTW, I wonder about using satellite measurements to validate models, since the output of models is surface temp and satellites measure broad sections of the atmosphere (including parts of the stratosphere) is it a valid comparison?)
May 13th, 2008 at 10:29 pm
There are measures for comparing the similarity of two probability distributions…Bhattacharyya distance for one, Mahalanobis is another.
May 13th, 2008 at 10:38 pm
I used multivariate versions of those two measures many years ago in some statistical pattern recognition work. Which is essentially the problem Mr. Pielke is describing. He does seem to have a more sophisticated view of the problem. Its not enough to compare the mean of distribution A to the rather healthy spread of distribution B as a test of whether the realization that the mean represents does in fact come from B. Using thresholds and integrating the overlap of the two distributions gives you an idea on the error rates for the two features.
May 14th, 2008 at 12:59 am
Jaye,
Of course there are various ways of comparing two distributions, but here we have one predictive distribution and a *single* realisation of reality, with some slightly different observational analyses. The null hypothesis here is that the realisation is drawn from the distribution, and this “analysis” provides no evidence to the contrary.
Roger, regarding my “stubborn refusal” – the observation of 990+-50 could be said to be consistent with 1000+-100 at an *even higher level of confidence* than the observation of 901+-50. But *both* observations obviously pass the threshold defined by your stated predictive range. End of story.
If you do choose a stiffer threshold then you run a greater risk of wrongly rejecting a model even if it is perfect. In your example, even if the true number of whales is exactly 1000, it is rather unlikely that an observational estimate with a standard error of 50 will get within 10 of this value.
What is the hypothesis that you believe you are testing when you look at the amount by which the observational uncertainty extends beyond the predicted range? If one could only count the number of whales with a precision of +-300, what values would pass your consistency test (given the same prediction of 1000+-100), and what values would fail?
May 14th, 2008 at 5:00 am
James-
You seem to have overlooked the fact that I have never claimed that the observations are inconsistent with the model spread, so why you keep focusing on this point is beyond me. What I have repeatedly asserted is that there is indeed a legitimate basis for someone to claim inconsistency as the issue is not black and white. Consistency is a matter of degree, probability. Perhaps you disagree.
I have argued that there is a nonzero probability that the observations on an 8-year period are inconsistent with the models. This nonzero probability is large enough for me to claim that RC was wrong when they said such claims were unsupportable. They are indeed supportable at some level.
Now, unless you are willing to argue that there is a ZERO probability that the observations fall outside the model range, then we are just splitting hairs about the semantics of the term consistency.
You keep asking me for statistical tests to perform. I honestly don’t know what the proper test is — perhaps something like the “overlapping coefficient” between two distributions:
http://mrw.interscience.wiley.com/emrw/9780471667193/ess/article/ess1900/current/abstract
I am pretty sure that in this case we are not dealing with a Student T test.
We are now deep into philosophy. We have many different models of open systems, with many different statistical characteristics, with an unequal number of runs, and we have observations with similar differences. We do not have balls and urns. I know why modelers look at the world as a “realization”, but I frankly think that this is just wrong. The world is infinitely more complicated than the models. I don’t even know what it actually means to take a “mean” across the models, and if that conveys something useful.
On you question about the hypothesis I think we should focus on — My goal here is to examine the forecasts, not the models. So we have two distributions (please just forget about where they came from, e.g., the observational distribution could just as well come from a large N of observations of multiple universes, whatever). The point is to compare the distributions and evaluate their degree of overlap. The point is not to compare 2 sample means.
This is why I suggested the “overlapping coefficient” as a perhaps proper test.
On your question of the perfect model — if a model says that the number of whales is 1000 and the observations say 901 +/- 50, then how in the world would you know that the model is perfect??? If this situation were to occur I would have no problem saying that the distributions do not overlap! The model would be decidedly imperfect.
Your haughty tone and demands for closure on what is certainly not a closed subject — how to evaluate the statistical properties forecasts and observations across small N open-system models producing small N forecasts — certainly does lend credence to those who suggest that some modelers have closed the books on learning after stats 101 and especially philosophy of science 101.
These are not simple issues, and it is indeed OK to discuss them. If you don’t, perhaps because you know everything already, then just don’t. I for one think that the issue of forecast-observational comparisons has been treated far to cursorily in this community. If, as you say derisively (or perhaps to intimidate me), it is only of interest to “denialists” then what a sad statement about your community.
May 14th, 2008 at 6:20 am
Okay, if we use Roger’s overlapping method about 70% (eyeballing) of observations are covered by the model, so we could say that it is 2 to 1 that the models are consistent with observations. Once we consider what has happened in internal variability–the recent prominence of La Nina and the fact that we are on a downslope of the 11 year solar cycle–the fact that observations are in the lower half of the projections makes a lot of physical sense.
So, I agree that there is a nonzero chance that the observations could lie outside of the predictions. However, it appears that the models are likely correct.
May 14th, 2008 at 10:47 am
I only have 2 years of statistics and another 2 of econometrics in my formal education so I don’t feel I have anything substantial to add to this interesting discussion. However, may I suggest a re-focus on the title of this thread?
In spite of a passing comment above by James that I don’t fully understand, I gather that his position would be that, using the definition of consistency that even the most novice of the statisticians would be accustomed to, 2 straight decades of cooling would still be consistent with the IPCC models global warming projections (given the kind of overlap we see for the 8-year trend). Would that be correct? If so, how useful is that sort of statistical consistency, say for policymakers? (I believe this could be Roger’s main point).
May 14th, 2008 at 10:48 am
I only have 2 years of statistics and another 2 of econometrics in my formal education so I don’t feel I have anything substantial to add to this interesting discussion. However, may I suggest a re-focus on the title of this thread?
In spite of a passing comment above by James that I don’t fully understand, I gather that his position would be that, using the definition of consistency that even the most novice of the statisticians would be accustomed to, 2 straight decades of cooling would still be consistent with the IPCC models global warming projections (given the kind of overlap we see for the 8-year trend). Would that be correct? If so, how useful is that sort of statistical consistency, say for policymakers? (I believe this could be Roger’s main point).
May 14th, 2008 at 10:57 am
Roger:
You haven’t chosen to address my post above. However, your ensuing responses to others make it clear that the point you’re making is rather trivial:
All empirical observations must, to some degree, remain uncertain (Hume). Therefore no one ever can PROVE absolute consistency between any model and any set of observations (small or very large) – even if the overlap of a model’s sample-output distribution and sample observations ‘happened’ to be IDENTICAL!
So you’re an ‘extreme’ skeptic. You seem to object to ANY claims of “consistency”, perhaps because you’re afraid it will ‘mislead’ policy makers, and those who influence them.
In what way does this analysis fail to define your differences with Gavin?
How shall we avoid the twin problems of the Scylla of inaction and the Charybdis of premature wrong action? Shouldn’t we try to get ‘everyone’ to agree (as an axiomatic convention) to some metric(s) for judging confidence (some measure of uncertainty/certainty) in ’scientific’ output?
May 14th, 2008 at 1:36 pm
Cherry picking the mean from a random sample of observations as *single* realization is not kosher imo. You have to compare the distributions of the estimates to the observations. I think its perfectly reasonable to do this without invoking Hume. If the best instruments can only predict a parameter with a certain amount of precision and accuracy, then a good model has account for the bias and the variance. Nevermind, that we have several “instruments” each with their own error sources and we don’t even really know which instrument is the most accurate and precise. Just yanking out the mean of the observations (for a single instrument of unknown pedigree) and comparing that to your model spread doesn’t make much sense.
May 14th, 2008 at 2:40 pm
Dr Peilke.
A similiar disputation about “consistent with” language has been ongoing over at CA. It occurred to me to look at the matter this way.
In attribution studies the GCMs are run with and without GHG forcing. And, it is argued that the observations are inconsistent with GCM runs that dont include GHG forcing, but are consistent with those runs that do include GHG forcing.Hence the attribution.
It would be an instructive excercise to look at what “consistent with” means in an attribution study as opposed to what it means in a “projection”
May 14th, 2008 at 2:51 pm
I’m always amused at the RC policy of not linking to the arguments they are counter arguing. It gives the impression they are worried people might actually read the original argument along with the points in support of the argument. (If they don’t want to pass google link juice, they can always “nofollow” the links!)
Anyway, I don’t know what question Gavin is trying to answer about the skill of these models. The comparison to data indicates they are biased in the mean, and quite significantly so.
They are falsified in the sense that the central tendency predicted for the climate trend is to high when compared to data. The 1 sigma uncertainty bounds also falsified the first time I did the test. The analysis account for “weather noise”.
I was as surprised as anyone when I obtained this result the first time I did it. (I expected “failed to falsify” both due to the likelyhood the projection/predictions are not far off and the small amount of data that make type 2 error very large at this point during analysis.)
The comparison Gavin made doesn’t show the “falsification” of the skill of the models is invalid, because the standard error in his comparison includes “climate model parameterization noise”.
What is possible is that some models in the group are not biased. But collectively as used by the IPCC, the central tendency of the projections appears biased high. Moreover, the error bars the IPCC has chosen to SHOW to the public also fall outside the range, and falsify– being biased high.
From the point of view of informing people about the probable trajectory of the central tendency of the climate trend, the IPCC information is either a) wrong or b) extremely deceptive.
Some climate modelers appear to have chosen a method of evaluating models that ensure that wild amounts of imprecision mean we must ignore bias. This is rather unsettling.
May 14th, 2008 at 2:53 pm
Boris, I have two models. One predicts GSMT has been and always will be 28C. The other predicts that GSMT has been and always will be 0C.
Are they falsifiable? Yup. if GSMT falls below 0C or rises above 28C they are falsified. and I will adjust the models accordingly.
Do they hindcast accurately?
Well, if you average the models and come up with 14C
they hindcast ok. Not off by more than 1C. the average of the models is “consistent with” the historcial observations.
Do they forecast ok. ? Too early to tell, but the current observation falls within the envelop of my two models and thus, my two models are
1. falsifiable.
2. Consistent with observations.
ah yes.
3. Totally useless.
I’ll duck out while the fruit flies
May 14th, 2008 at 4:11 pm
No fruit from me, Steven. You made the point I was trying to make earlier, but in a much more sensible way. James Annan can argue that the models are ‘consistent with’ observations, and be absolutely correct in a statistical sense, but totally misleading to policy makers.
In the context of this website discussion, we can understand how the models can be consistent with observations (in a statistical sense) and yet totally useless at predicting future climate scenarios. Policy makers and the general public, however, will have a much more difficult time understanding the nuance. For them, the ‘consistence with’ argument is incorrectly viewed as a testament to significant model skill.
Roger seems to be much more aware of this than James, and wants to express ‘consistency’ in a way that policy makers and the general public will understand, while possibly confusing statisticians. It is obviously better for humanity if decision makers are clear on the issue and statisticians are a little confused than the other way around.
May 14th, 2008 at 4:23 pm
Models. One set gives 900-1100 and overall observations give 850-950. If the models are actually at 900 and observations at 900, they match perfectly. But if models are at 1100 and observations are at 850 then they are wrong. Is this inconsistent or is this undefined or is this bias or is this lack of skill or is this something else whatever you want to call it. Is the overlap of the two from 900-950 enough to say there is whatever you want to call it.
Good point Steven Mosher. Is not what this all becomes?
1. 2 falsifiable models.
2. Average consistent with observations, the most trusted estimate of a global temperature of 14C)
3. Useless since both are wrong by themselves.
gamoonbat said earlier “My gut reaction to all this is that eight years is just too short a period to be talking about a climate trend.”
Why? We are well within 1 C of 14 C no matter how it is sliced. The trend for the last 8 years is +.25 The trend for the last 4 months is +.35 The trend for the last 12 months is -.2 The trend for the last 30 years is +.5 This matches well with the trend over the instrument record of +.7 The only two questions to answer is if a new base period of 1981-2010 will tell us anything more interesting, and if a yearly anomaly will ever exceed +.62 in the future.
The question then becomes if carbon dioxide is a major factor in the composition of the anomaly, since levels have been rising consistently, what weather events have given us a negative trend over 12 months and a trend over 8 years no greater than the difference between March 2008 and April 2008 and a trend over the last 30 years that is lower than the anomaly in any year in the instrumental record?
May 14th, 2008 at 4:53 pm
Jim clarke And Lupo.
These guys need to learn to spell Skil.
opps. Skill.
May 14th, 2008 at 5:03 pm
Lucia,
The RC policy of not linking is a PR philosophy.
Linking = endorsement. It’s a shallow tribalist mentality. Dont take it personally.
May 14th, 2008 at 8:00 pm
Steve–
I don’t take it personally. I simply observe.
I’m thinking may need to add the following mathematical tidbit with regard to falsification:
1) Doing falsification using real weather data: uncertainty bars on the trend are size “u”. Generally speaking the 95% confidence interval is roughtly “2u”.
2) Doing falsification using the ensemble of climate models with weather data *plus* the extra spread due to the spread in predictions due to different modeles, uncetainty intervals are
U= sqrt(u^2 + v^2) where “v” is the standard deviation associated with the climate models.
Once again, the 95% confidence interval is generally roughly “2U”.
So… if “v” is non-zero because climate models that predict somewhat different underlying trends (and which result in uncertainty bands in the IPCC documents), you will always falsify based on actual weather before you falsify based on teh climate models.
If “v” is very large compared to “u” it will take a long, long, long time before you can falsify the models using the method Gavin insists on.
May 15th, 2008 at 8:46 am
lucia,
“I simply observe” is perfect. I’m going to go back to the IPCC and see if they will grant me access to the data. Rogers P, Jr&Sr should be able to get access. had any luck mates?
May 15th, 2008 at 8:42 pm
Steve Mosher said:
”
It would be an instructive excercise to look at what “consistent with” means in an attribution study as opposed to what it means in a “projection”
”
I couldn’t agree more – here is a chance for James to put his money where his mouth is. Show us what “not consistent with” means in the attribution study, and that you apply the same standard when testing your projections. Surely that’s not too difficult?
May 16th, 2008 at 8:52 am
It seems to me the realclimate folks want to have it both ways. On the one hand they say the models are very accurate and getting more accurate all the time and on the other hand they are saying that anything from -10 degrees to +13 degrees every 8 years is consistent with the models. This is not “high” accuracy. Either the models are accurate and make specific predictions or they are inaccurate and allow for wide ranges of temperature fluctuations over 8 years that leaves any predictions meaningless.
To me it seems the modelers have this problem but they also have a number of other problems:
1) explaining how we will get 2 degrees C by 2100. While the skeptics only need to show that AGW is not a serious problem, AGW enthusiasts need to be able to show not only the GW is happening but that it will be damaging. This means they need to show 2 degrees and they need to show that 2 degrees is damaging. Both of these assertions are highly suspect.
2) It is not clear how or why we will suddenly get a massive increase in temperature necessary for them to get back to a 0.2 degree/decade rate of growth in temperature. Such a move in the average rise will require a massive and sustained increase in temperature which isn’t consistent with the record. Other than sporadic events like the ENSO the climate record is relatively smooth and it is not obvious to me at least that there is any observed time where temperatures have moved the way the AGW enthusiasts now need the temperature to move to achieve the 0.2 trend in the next 10,20 or 30 years. Therefore it is highly likely they will miss 20 and 30 year projections they have made as well as the 8 year trend. Therefore if they say, let’s wait 20 years we already know that they are very unlikely to meet the 20 year objective either. It will require a statistically highly improbable temperature trend for them to get back on track.
3) The lack of a tropical warming of the troposphere appears to have the same statistical problems. What the AGW cummunity seems to be saying is that we have this theory. You can’t disprove it because we accept any variation from the theory as being statistically irrelevant even if common sense would indicate the theory is disproved. Yet we want you to believe in this theory. This is more like what a person who believed in a religion would say, not a scientist.
4) this is “science” unlike any science I know. When a theory is falsified they adjust the model until the data matches the theory. Then they make predictions and when those predictions fail they simply modify the model again. All along claiming the underlying theory is sound. This is not science. It may be some sort of “philosophy” but it isn’t science. The models are built using data constructed from the models utilizing “reverse method” fitting. Anybody can fit a model to a set of data with suitable adjustable parameters but you can’t use such retrofitting to “validate” the model. The only statistically and scientific position is that in 2001 when the models were issued the predictions were made. The data in the subsequent 8 years completely go against the models. This is disproof. No scientist can be allowed to go back, jigger the models endlessly and say I “predicted that”. By having to jigger the models and to introduce new physics and effects, change the magnitude significantly of feedbacks or even the sign of feedbacks into the models and then claim they were right all along is not science.
Either the models are accurate and they understand the significant deviations from the models that can occur (i.e. ENSO and other poorly explained phenomenon) or they don’t know what will happen in the future. If they take the position they understand “pretty well” all the effects then how come they can’t explain the 8-10 years of lack of temperature increase? Surely even if the models missed the prediction they should be able to tell us why the 8 to 10 year trend has gone against them. In the past they have modeled volcanoes to show why certain anomalies occurred. THere is no explanation for the current deviation which leaves the whole endeavor suspect. If you don’t know why there has been an 8 year hiatus then how do we know this hiatus will continue indefinitely or that there are other effects modelers haven’t figured out yet?
I am perfectly happy with believing GW is happening. I fly frequently and have noticed that it seems like half the planet is covered in ice so I am not “scared” of a 2 degree or even larger warming. I think we live on a cold planet. I believe there are benefits from warming that are under-appreciated. So, I am happy to accept warming as a theory. The fact is that the theory looks dead. There may be warming going on but it is insignificant and is probably trending very close to what it was last century which turned out to be net positive benefit for the world and relatively insignificant unfortunately. I personally wish AGW was true. I want to believe it but as a scientist I cannot accept the data and the modelers claims as convincing.
May 16th, 2008 at 3:42 pm
mathon:
I enjoy your comment about science and philosophy.
Is that perhaps why an advanced science degree is called “doctor of philosopy”?
May 17th, 2008 at 6:44 pm
I have no learning in statistics, but what I get from this exchange is that modelers have allwed themselves quite a loophole in the presentation of their expertise in predicting ‘climate change’.
Are there modelers that aren’t invested in the AGW theory?
May 18th, 2008 at 7:35 am
“Consistent with” is boolean. Given a model and observations, each with its confidence interval, wouldn’t it be more useful to discuss the probability of consistency?
May 19th, 2008 at 4:20 am
There is another fundamental problem with Rogers consistency discussion.
There is stochastic internal variability in the climate system. GCM runs are not designed to represent this variability in time, i.e. simulate the ups and downs at the right time, because such a forecast is more difficult to produce. GCMs are designed to simulate the long-term behaviour as accurately as possible. Long-term behaviour means the trend over at least 20-30 years. Thus it makes no sense at all to test the quality of model by comparing the current short term variability to the model results. The only useful information on 8-year trends you can take from GCM runs is the range of possible trends, but not any information on the current trend.
Let’s take an example:
Let’s take a climate (or weather) model which predicts that (due to the position of the earth’s rotation axis and corresponding changes in insolation) there will be a positive overall temperature trend in central Europe from January to June of maybe about 3 plus/minus 1 K per month. Because this model is not reinitialised with the current measurements every day, it will only simulate the long-term behaviour due to the external forcing correctly, but not the chaotic internal weather variability.
Now with the logic of Roger, e.g. a negative trend over three weeks (e.g. from 3rd to 24th of April) of -2 plus/minus 0.5 K will clearly be inconsistent with the model and falsify the model (because the ranges do not overlap). In consequence, this would mean that a negative temperature trend over three weeks would falsify the forecast, that mean June temperature with very high probability will be warmer than January.
This is nonsense. As is the comparison of GCM long-term trend projections to observed 8-year trends.
May 19th, 2008 at 8:26 am
Urs- Thanks for your comment.
I proposed the following to climate modeler James Annan:
“Long-term behaviour means the trend over at least 20-30 years. Thus it makes no sense at all to test the quality of model by comparing the current short term variability to the model results. The only useful information on 8-year trends you can take from GCM runs is the range of possible trends, but not any information on the current trend.”
And he rejected this, so apparently there is some disagreement within the climate science community on this.
If the following is “nonsense”:
“the comparison of GCM long-term trend projections to observed 8-year trends”
Then it should not be done by Real Climate, and it is improper for anyone, including the IPCC to compare short time scales with GCM predictions. If this means less than 20 years then scientists should say so, and this would invalidate the Rahmstorf et al. analysis and the IPCC Figure in its TS comparing predictions and observations on time scales less than 20 years.
Clearly your community is not of one mind on this.
May 19th, 2008 at 4:12 pm
How many years is ‘enough years’ depends on the purpose. If 8 years shows that they do or do not match the trend over that time then it only goes to show that the models as a group are not good for telling you what the next 8 years will be. Or that the range of model guesses is so wide as to make whatever consistency is being shown as inconsistent due to the meaningless of the answer and not due to a lack of overlap.
May 20th, 2008 at 4:23 am
Roger, sorry, but this is ridiculous. It was you who did the comparison of the 8-year trend to the GCM projections on this website on 9 January. Then Realclimate explained in a post that this does not work and clearly stated (citation): it should be clear that short term comparisons are misguided.
I am sure, James, if he really did (where?), only rejected part of your proposition, namely that it makes no sense to compare short term variability. Of course, it can make sense to compare 8 year trends in reality and in GCMs to test if GCMs get the short-term variability in general right (but not an individual one, because they are not designed to). However, you have to compare like with like. That means, you have to compare the variability in GCMs to the variability of the measured sample of 8 year trends over e.g. the last 50 years and then test if the distributions are similar or different (and you would have to compensate for the long-term trend and volcanic eruptions). But that is not what you have done in this post. You compared the variability in GCMs to the measurement uncertainty in one single realisation. The comparison of these two distributions is nonsense, because they describe totally different things.
The recent Realclimate post discusses the short term variability of individual GCM runs and not the validity of long-term trends.
My comments are in perfect agreement with the Realclimate posts and certainly with James Annans comments (just ask him if he disagrees on any point).
May 20th, 2008 at 6:54 am
Urs-
Let me correct one misinterpretation that you have. My effort to compare observations with forecasts was motivated by the IPCC doing the exact same thing, including highlighting a 6 year (!) post-TAR trend. I don’t recall you or Real Climate finding fault with those efforts, but perhaps I missed your critique?
You write:
“you have to compare the variability in GCMs to the variability of the measured sample of 8 year trends over e.g. the last 50 years and then test if the distributions are similar or different (and you would have to compensate for the long-term trend and volcanic eruptions)”
I indeed posed exactly this option to James and he rejected it in favor of arguing that the most recent 8 years are consistent with model predictions.
It is one thing to say that short-term predictions of the IPCC are (a) not really made and (b) not to be expected to be skillful.
It is quite another to say that such short-term predictions of the IPCC are (a) not really made and (b) but consistent with observations.
The latter is a bit of eating your cake and having it also. It also sets the stage for overselling what the models are designed for.
There is no crime in admitting that IPCC predictions for the short term were presented with misleading (too small) error bars for comparison with what actually will evolve on plant Earth.
May 21st, 2008 at 1:51 am
Roger,
It is a third thing to say, and that is what I really said, that (a) the IPCC did not make short-term predictions and (b) that observations are consistent with the short-term variability in the models (but not short-term predictions, because there aren’t any!).
The IPCC projects a mean(!) trend of 0.2K per decade over the next two decades. This does not mean a 0.2K trend over the next few years.
In the same way as the prediction that the temperature trend from March to July will be positive in any case (for all 95% range) does not mean, that temperature will rise during the next week. Temperature trends over a week have much more variability than the trends from March to July.
Would you pretend that a week with a negative temperature trend is inconsistent with the prediction that the trend from March to July (in the northern hemisphere) is always positive?
Why do you persistently ignore the difference between variability of a variable and a specific value a variable has taken?
Could you please tell me where exactly the IPCC compares a six year trend to model results (chapter, page, citation)?
BTW, the reality of the last 30 years clearly has shown that negative 8 year trends are perfectly consistent with contemporaneous 0.15K/per-decade-trends over 20 years
May 21st, 2008 at 8:59 am
Urs-
Thanks again for your substantive comments. Some reactions and answers follow:
1. On whether on not the IPCC made short term predictions, it certainly did. Figure 10.26 for example shows temperature increases and uncertainty ranges (for the forced component) beginning in 2000. Over at Real Climate they go into the model output to show spread of IPCC predictions for 7, 8, 10, and 20 years into the future. No where have I seen the IPCC say anything about the lack of skill, accuracy, or consistency in short-term forecasts (<20 years). perhaps they did, and if so, a pointer would be welcomed.
2. Whether or not a short-term trend (say the first 8 years of 20 years) is consistent with the 20-year trend is a matter of probability. It is perfectly fair to ask the question, and it has multiple answers, since we are not dealing with the onset of summer or playing cards or rolling dice. Sorting through those questions and answers is a perfectly reasonable thing to do.
We are of course dealing with an open system which is represented in a variety of ways (models) with a single realization that matters (Earth).
You analogy suggesting that climate model predictions are as certain as the onset of summer is noted. However, given that humans have observed the onset of summer tens of thousands of times, and climate model predictions of the 21st century exactly zero times, perhaps we need to find a better analogy.
3. Citation: Chapter 9, WG I, p. 683, in reference to the period 2001-2006:
“Six additional years of observations since the TAR (Chapter 3) show that temperatures are continuing to warm near the surface of the planet.”
If that sentence were re-written today would it say something like the following?
“Six additional years of observations since the TAR (Chapter 3) show that temperatures are NOT continuing to warm near the surface of the planet, WHICH IS OF COURSE CONSISTENT WITH PREDICTIONS OF LONG-TERM WARMING.”
4. You state: “BTW, the reality of the last 30 years clearly has shown that negative 8 year trends are perfectly consistent with contemporaneous 0.15K/per-decade-trends over 20 years”
Please show me eight-year periods in the historical record with a negative 8-year trend, which did not occur immediately after a major volcanic eruption. I am not saying that there are no such periods, but I do know that there are none in the past 30 years unaffected by volcanoes, which makes your statement a bit misleading. Just let me know those dates.
Thanks!
May 22nd, 2008 at 2:03 am
Roger,
1. Figure 10.26 does not show in any way short term forecasts. Presented are at least 20 year means. An 8 year period of a 20- or 30 year running mean is not equal to an 8 year short term forecast.
2. No. If you have a curve with much interannual noise and a long-term trend, it is not a matter of probability, but a matter of the signal-to-noise-ratio. The test of consistency to the long-term trend is only reasonnable for a period where you have a reasonnable signal-to-noise ratio. The winter-summer example is a perfect comparison, since you have on the one hand a (relative) long-term trend due to external forcing (insolation change due to earth axis, and greenhouse forcing, respectively), and short term variability (noise) due to internal chaotic behaviour of the system (weather, and internal oscillations, respectively) on the other hand.
What you are doing is testing, if the noise is consistent with the signal. This makes no sense at all. You compare completely different things.
Climate models are certainly not as certain as the onset of summer, I used the analogy to show the difference between an externally forced long-term signal and internal noise (see above).
3. Note the difference: IPCC is talking about 5-year mean temperatures (2001-2005), not 5-year trends. This is a huge difference. If you compare 5-year periods (1971-1975, 1976-1980, etc.) you see always a rise from one to the next period. That’s what IPCC meant. Let’s see what 2006-2010 will be. But I agree, that a 5-year mean still contains some noise (but is much better than an 8-year trend, because there is less noise) and a 10-year mean would be better.
2003-2007 is warmer than 1998-2002 by between +0.05 and +0.1 K (depending on the dataset), so the statement would be the same.
4. You are right, that there is an influence of volcanoes. But that was not my point. I was just saying, that in principal negative 8-year trends (whatever the reason would be) are consistent with contemporaneous unambigously positive 20-year trends. You agree? BTW, there were no volcanoes and no negative trends during the last 8 years, you agree?
May 22nd, 2008 at 10:06 am
Urs-
Thanks for your continuing comments. A few more reactions follow:
1. What 20-year period in Figure 10.26 is meant by the data shown for, say, 2008?
2. I’d be curious as to what you view as the appropriate time frame for which signal rises above noise? It is not 8 years, so how long?
3. Are yo really saying that comparing two 5-year means is not subject to the same issues of noise that you claim make 8-year trends useless? Really?
With regards to the following: “If you compare 5-year periods (1971-1975, 1976-1980, etc.) you see always a rise from one to the next period.”
Are you sure about this?
How do I reconcile the claim that 8-year cooling trends are consistent with longer term (20 year) trends, but every 5-year period will “always rise”? Logically this cannot be so (since a year period of warming followed by 8 years with negative slope, won’t show the average of the latter to be warmer than the earlier period).
How about this: The IPCC probably overstretched in this claim?
4. There have been no volcanoes over the past 8 years significant enough to affect forcing (so I am told), but the fourth figure here shows a negative trend (but only for 7.25 years):
http://sciencepolicy.colorado.edu/prometheus/archives/climate_change/001433do_ipcc_temperature_.html
May 23rd, 2008 at 3:07 am
Roger,
1. 1998-2017. (I am not sure that it is 20 years, it might be more. IPCC uses 20 or 30 year means. In AR4 it mainly was 20)
2. The time frame depends on the signal to noise ratio. I do not know, if there are common definitions or rules. In principle, if you want to compare to 20 year trends, it is of course best to use 20 year trends. However, a time frame of about 12 to 15 years might be sufficient (15 year trends do not show much variability anymore).
3. You misunderstood. I say two things:
- the difference between two subsequent 5-year periods has less variability than 5-year trends
- subsequent 5-year means have the problem with noise, they are comparable to 10 year trends (8 year trends are not that different, that is true).
- the differences I mentioned (starting with 1971-75 period) are always positive. However, you find a few negative differences if you take other sequences.
I agree that five year means are not suitable for statistical “proof” of long-term trends. What you can say is that the observations show what is most probable if you have a long-term warming trend (positive differences in 90% of the cases). That’s what IPCC meant. It is, however, not a very strong argument, I agree. It does not confirm model projections, but IPCC didn’t claim that.
4. Are you sure, that without volcanoes there would have been no negative 7 year trends in the 80ies and 90ies? On that scale, you also have ENSO variability (and other). It is difficult to eliminate the volcano influence in the data, one could use model data, but since you do not trust the models, this does not help. However, I do not expect 7 year trends to be always positive. But for 15 year trends, I do.
May 23rd, 2008 at 10:01 am
“The trend being flat for the last 13 years at about .2 is not inconsistent with predictions of 20 year or longer warming at .2 per decade.” maybe?
It is “not inconsistent”
Starting at 1995, we only have to wait until 2014 to see if it was consistent or not, don’t we?
To answer the question, periods of 8 years with a negative sloping trend start in 1988, 1987, 1986, 1980, 1979, 1970, 1969, 1968 and 1967. Then I stopped. So an 8 year negative trend is not unheard of, but there hasn’t been one in 20 years. You see they used to happen every 10 years or so? So it is rare now. Volcanos in those years, yes? What about our volcano this year what will it do.
Jan 2000 to Apr 2008 has a trend of .02 so far with YTD at .35 Will 2008 end up like 2000 or 1999 or 1996? That would change an 8 year trend of .2 to basically zero, wouldn’t it?
8 years from 2007 back is .18 about the same as 9-13 years. Seems the trend stays the same at ~.2 So 6 flat years? But it appears the trend so far is about .15 per decade, yes. And sometime in a decade lower than usual yearly anomaly grabs the trend to that figure, such as in 1992-1994
Number of years since 2007 trend backwards in time
7=.08
8=.18
9=.22
10=.18
11=.18
12=.22
13=.22
14=.30<—1994
15=.35<—1993
16=.42<—1992
17=.40
18=.38
19=.40
20=.40
30=.55
40=.70
50=.60
60=.65
Seems like a forecast of .15 or so C per decade is an easy forecast to make these days.
May 23rd, 2008 at 10:28 am
That there has been no rise in the trend for the last 13 years is a perfectly fair thing to say.
That there has been a rise in the trend of between .15 and .20 every decade for the last 4 decades is also a fair thing to say. Perhaps a caveat that has to be done in groups of longer than 20 years averaged?
So it is also fair to say that a period of less than 20 years that is not on track for a .15 to .20 trend is not inconsistent (not yet proven consistent or inconsistent) with that rise.
And it is also fair to say that it is consistent –with past behavior — for a period of less than 20 years to not be on track for a .15 to .20 trend.
But it is not fair to say the *last 10 years* is *consistent* with a .15 to .20 rise per decade, is it?
It has to be qualified, right? Throw in a “It’s not consistent because less than 20 years is an unreliable time period” or that the last 10 years is not known to be consistent or not because the models or what have you can’t deal with a time period that short because it is too variable. Is that fair?