Comparing Distrubutions of Observations and Predictions: A Response to James Annan
May 15th, 2008Posted by: Roger Pielke, Jr.
James Annan, a climate modeler, has written a post at his blog trying to explain why it is inconceivable that recent observations of global average temperature trends can be considered to be inconsistent with predictions from the models of the IPCC. James has an increasing snarky, angry tone to his comments which I will ignore in favor of the math (and I’d ask those offering comments on our blog to also be respectful, even if that respect is not returned), and in this post I will explain that even using his approach, there remains a quantitative justification for arguing that recent trends are inconsistent with IPCC projections.
James asks:
Are the models consistent with the observations over the last 8 years?
He answers this question using a standard approach to comparing means from two distributions, a test that I have openly questioned its appropriateness in this context. But lets grant James this methodological point for this discussion.
James defines the past 8 years as the past 8 calendar years, 2000-2007, which we will see is a significant decision. As reported to us by his fellow modelers at Real Climate, James presents the distribution of models as having a mean 8-year trend of 0.19 degrees per decade, with a standard deviation of 0.21. So lets also accept this starting point.
In a post on 8-year trends in observational data Real Climate reported the standard deviation of these trends to be 0.19. (Note this is based on NASA data, and I would be happy to use a different value if a good argument can be made to do so.) I calculated the least-squares best fit line for the monthly data 2000-2007 from the UKMET dataset that James pointed to and arrived at 0.10 degrees/C per decade (James gets 0.11).
So lets take a look at how the distribution of 8-year trends in the models [N(0.19, 0.21)] compares to the analogous 8-year trend in the observations [N(0.10, 0.19)]. This is shown in the following graph with the model distribution in dark blue, and the observations in red.
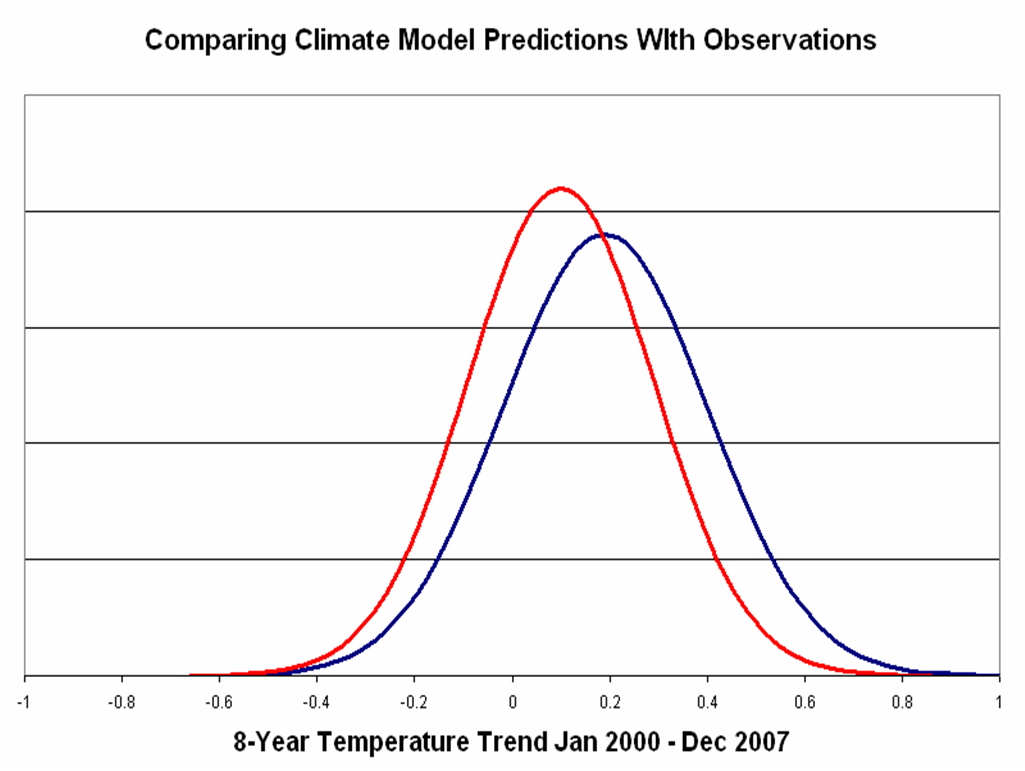
Guess what? Using this approach James is absolutely correct when he says that it would be incorrect to claim that the temperatures observed from 2000-2007 are inconsistent with the IPCC AR4 model predictions. In more direct language, any reasonable analysis would conclude that the observed and modeled temperature trends are consistent.
But now lets take a look at two different periods, first the past eight years of available data, so April 2000 to March 2008 (I understand that April 2008 values are just out and the anomaly is something like half the value of April 2000, so making this update would make a small difference).
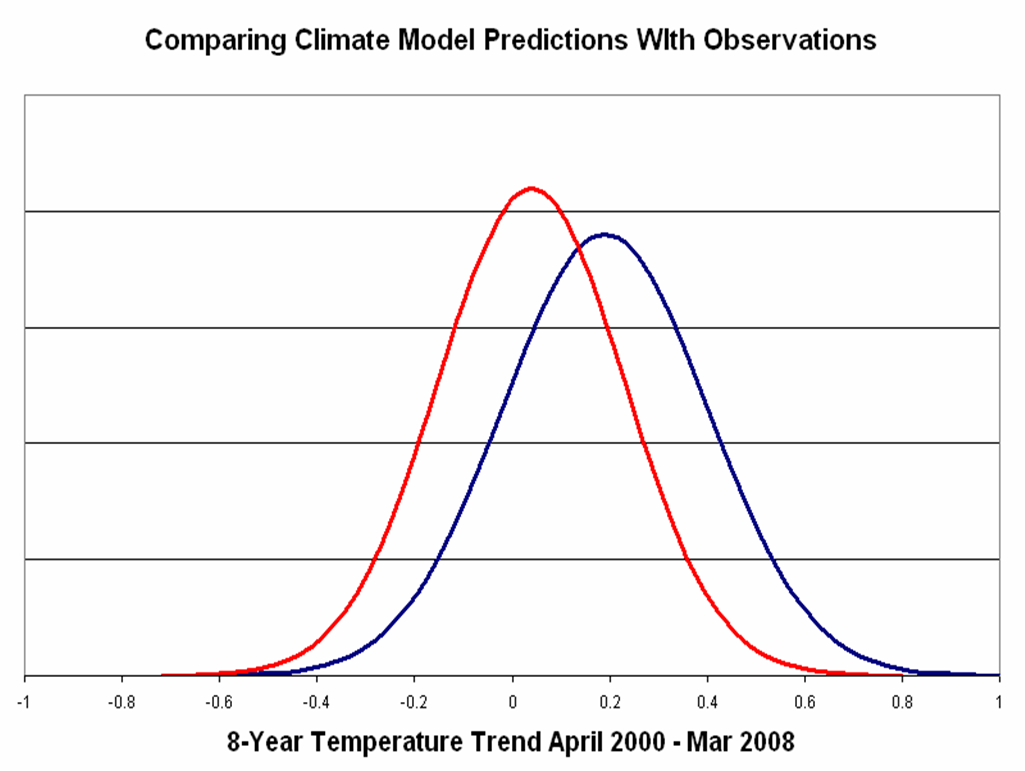
You can clearly see that the amount of overlap between the distributions is smaller than in the first figure above. If one wanted to claim that this amount of overlap demonstrates consistency between models and observations I would not disagree. But at the same time, there is also a case to be made that the distributions are inconsistent, as the amount of overlap is not insignificant. There would be an even stronger case to be made for inconsistency using the satellite data, which shows a smaller trend over this same period.
But now lets take a look at the period January 2001 to present, shown below.
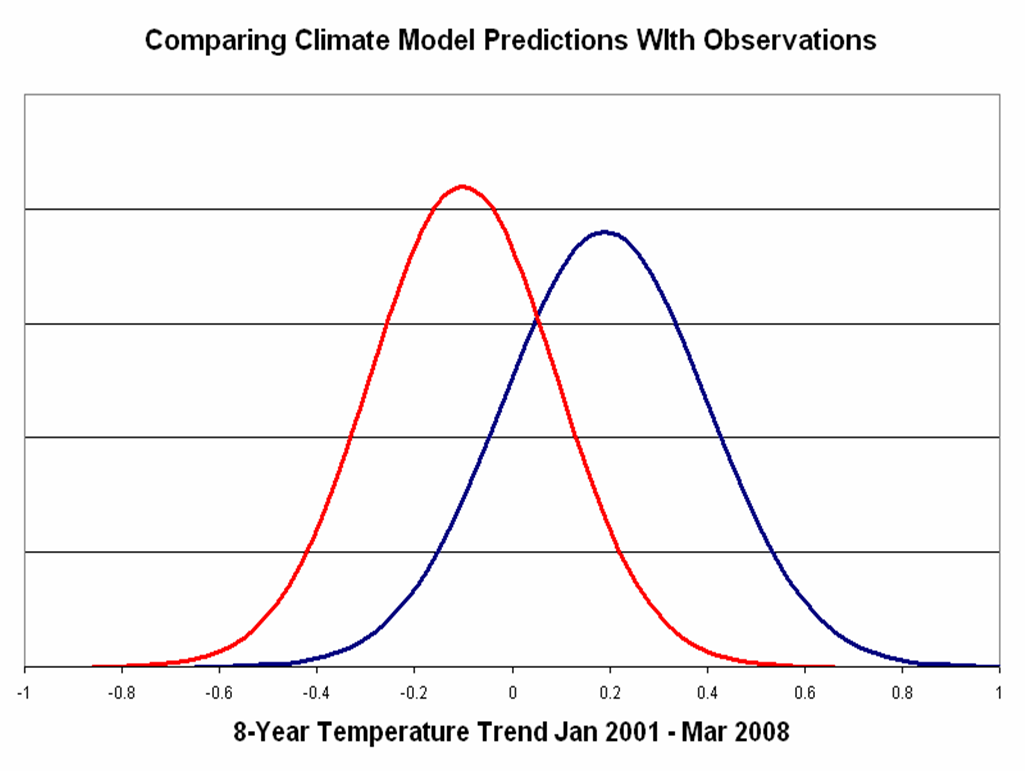
Clearly, there is a strong argument to be made that these distributions are inconsistent with one another (and again, even stronger with the satellite data).
So lets summarize. I have engaged these exercises to approach the question: “What observations of the climate system would be inconsistent with predictions of IPCC AR4?”
1. Using the example of global average temperatures to illustrate how this answer might be approached, I have concluded that it is not “bogus” or “denialist” (as some prominent climate modelers have suggested) to either ask the question or to suggest that there is some valid evidence indicating inconsistency between observations and model predictions.
2. The proper way to approach this question is not clear. With climate models we are not dealing with balls and urns, as in idealized situations of hypothesis testing. Consider that the greater the uncertainty in climate models — which results from any research that expands the realization space — will increase the consistency between observations and models, if consistency is simply defined as some part of the distribution of observations overlapping with the distribution of forecasts. Thus, defining a distribution of model predictions simply as being equivalent to the distribution of realizations is problematic, especially if model predictions are expected to have practical value.
3. Some people get very angry when these issues are raised. Readers should see the reactions to my posts as an obvious example of how the politics of climate change are reflected in pressures not to ask these sort of questions.
One solution to this situation would be to ask those who issue climate predictions for the purposes of informing decision makers — on any time scale — to clearly explain at the time the prediction is issued what data are being predicted and what values of those data would falsify the prediction. Otherwise, we will find ourselves in a situation where the instinctive response of those issuing the predictions will be to defend their forecasts as being consistent with the observations, no matter what is observed.
May 15th, 2008 at 11:32 am
Your first graph 2000-2007 has 2001-2007 in the paragraph under it.
“to claim that the temperatures observed from 2001-2007″
May 15th, 2008 at 11:40 am
Lupo- Thanks, typo now fixed.
May 15th, 2008 at 11:47 am
Roger,
In statistics the phrase “inconsistent with” is often followed by something like “at the 95% level”. If the level is not provided you can usually assume 95% because that’s the norm.
In this case you might be able to say “inconsistent with at the 25% level” or something like that. That is, there’s a roughly 25% chance that observations do not match model predictions. Or a 75% chance that they do.
If your only argument is that the observations *might* disagree with the models, then you’re right. That means that you also need to accept the converse — that observations *probably* agree with the models. Are you willing to do that?
May 15th, 2008 at 11:47 am
I have quite a few comments:
1) The standard deviation in the RC post includes a period with volcano eruptions.
Real Climate: “The mean of all the 8 year trends is close to the long term trend (0.19ºC/decade), but the standard deviation is almost as large (0.17ºC/decade), implying that a trend would have to be either >0.5ºC/decade or much more negative (< -0.2ºC/decade) for it to obviously fall outside the distribution.”
Your showing the analysis using the value of 0.19C is useful for a number of reasons.
First: It shows us that the standard deviation of the trend for the real earth during periods with volcanic eruptions (0.19C) is smaller than the value Gavin insists on for periods with NO volcanic eruptions (0.21C).
I think we can safely say that the variability based on 8 years of annual average data during a period with NO volcano eruptions is less 0.19C. Gavin’s value is not representative of the weather noise for the true earth — and no amount of saying “N years is too short” makes it so. It includes variability arising from the different parameterizations in climate models.
The variability I obtain for the recent period is lower than 0.19 C. The lower value makes sense based on phenomenological arguments. So far, no one has presented a real, sound argument to suggest the “true weather noise” variability during periods without volcanic eruptions is anywhere as high as 0.19C, nor have any of those presenting “rebuttals” — other than Gavin– suggested what that might be. (As we can see, Gavin’s number is higher than for the actual earth during periods with volcano eruptions, and so is not credible.)
Since my estimate of the variability of the true weather is smaller than 0.19, the statitistical significance I attribute to the mis-match between models and IPCC projections is greater that you find.
2) You, Roger, are using annual average data. That’s fine.
However, as you will recall, when I first thought about this– due to your challenge post, I told readers things weren’t going to falsify with annual average data. I estimated the “type II” uncertainties for these problems based on annual average data. I told my reader that we would need a very, very long period of flat temperature to falsify. This is partly due to “weather noise” and partly due to “measurement noise” and partly due to simply having too few estimates. They pressed me to find a method to deal wtih auto-correlation, and I found one for that reason. That’s why I use montly data– it lowers the risk of “type II” false negatives.
When two methods have equal false positive rates, I prefer to use the one with lower false negative rates. That’s why I switched to monthly data.
3) Some climatologists suggest it is bogus or denialist to suggest that one should test models against data? I would say word fail me, except that words never fail me.
In no other field do people suggest the idea of testing model predictions against real world data is bogus or denialist. If someone questions a model prediction that a particular airfoil shape has a lift coefficient of 0.3 based observation of the actual airfoil in a wind tunnel, the questions would not be called bogus or denialist. Might one suggest checking the data? Sure. Might one suggest checking the intepretation of the data? Sure. But questioning model preditions is routine in other fields.
Confident modelers simply answer the questions. When models are very good, they can rest assured that, in due time their model predictions will bear out. So, they rarely resort to name calling in defense of their model predictions.
4) Your suggested solution to the anger is wise. If those on panels could agree in advance to the methods for testing models, and demonstrate these methods answer the questions people ask, then obtaining the answer would simply be a matter of implementing the method. Moreover, the choice of hypothesis would no longer rely on the idiosyncratic choices of individuals. Because the methods would be nailed down before earth data arrived, all could feel more confident that the method, times, and techniques were not selected to obtain the result a particular analyst wished to obtain.
This would go a long way to reducing the suspicions and accusations of ill-will that appear to endemic to climate model blogs, forums and the field itself.
Finally: with regard to developing a standard method: There are open questions about the correct magntidue of the effect of the true weather variabilty on my estmate of the true weather variability. I’ve admitted them, and we have been discussing those amongts ourselves at my blog. There are ways we could look at GCM results to try to test whether the uncertainty bounds I estimate are too small.
However, what those methods might be would be a subject of an individual post.
May 15th, 2008 at 11:55 am
lucia said:
“Some climatologists suggest it is bogus or denialist to suggest that one should test models against data?”
I think what people are saying is that 7-years is too short. The observed trend can be very different than the underlying trend given only 7-years of data.
Testing the models is great but ignoring observation bias when performing the tests is, uh, not great.
Since you insist on testing a 7-year trend against the central tendency, it is at least appropriate to correct for the obvious sources of bias (ENSO, volcanoes, solar). Even Roger and I have agreed on that much.
May 15th, 2008 at 11:59 am
John V.- Of course!
May 15th, 2008 at 12:05 pm
Lucia-
Thanks. A few replies:
1. You write “I think we can safely say that the variability based on 8 years of annual average data during a period with NO volcano eruptions is less 0.19C.”
I agree with this comment. What this means is that the analysis I have presented here is biased in favor of finding consistency, which makes it all the more interesting a meaning probability of inconsistency.
2. I calculated the means of the UKMET using the monthly data.
Thanks!
May 15th, 2008 at 12:09 pm
Roger,
It looks like we agree on the interpretation of the observed vs modelled temperature trends. Just to be clear, are we both saying that observations probably agree with model predictions but might not agree?
If so, then we are both saying something very different than lucia. She is saying that observed trends are inconsisten with model predictions at the 95% level.
It is reasonable for you and lucia to disagree. But yesterday you linked and praised her post that explains why she thinks observations are inconsistent with model predictions at the 95% level.
So, do agree with lucia that the observed temperature trend falsifies the IPCC prediction? Or do you agree that the observed temperature trend probably agrees with the IPCC prediction? I don’t see how it’s possible to agree with both statements.
May 15th, 2008 at 12:27 pm
“Some people get very angry when these issues are raised.”
Well, people get frustrated when you and Lucia repeatedly show that you have no physical understanding. I mean, you add a year of observations and then you go from consistent to inconsistent. How can one year of data–which is almost entirely unforced (internal) variability be an observation essential to claims that estimates of forced variability are wrong? Doesn’t it occur to you that the weather of one year is what you are relying on to “falsify” the IPCC?
May 15th, 2008 at 12:36 pm
Picking various start dates sounds like cherry picking to me. What was the end date for the IPCC AR4 model ensemble observed data? Should that not be used as the starting point? — John M Reynolds
May 15th, 2008 at 12:39 pm
Boris, it is the year 2000 that has the unforced variability. That is why it makes a poor starting point… I guess I just answered my own question too. — John M Reynolds
May 15th, 2008 at 12:41 pm
Boris-
There is no point in getting frustrated with me or Lucia about the recent global temperature measurements, or their effects on trends when placed into an analysis.
If you had been following this blog, you’ll find that I’ve been asking this question for years, long before the recent apparent cool spell set in. Further, I recently published a correspondence in Nature Geoscience clearly showing that trends 1990-2007 in global average temperatures were highly consistent with 2001 and 2007 IPCC predictions.
If adding the most recent data to these exact same methods leads to somewhat different conclusions, then so what? Let the chips fall where they may.
And please stop claiming that I have said that I have falsified the IPCC. If you are reading the discussions here you know this is an incorrect representation.
May 15th, 2008 at 12:56 pm
Isn’t this just a matter of high uncertainty increasing consistency and low uncertainty increasing inconsistency? High consistency with uncertainty, and low consistency with certainty. At what certainty level does the word inconsistent come into play?
As far as time frames, clearly Real Climate thinks even ten years is too short, with the proposed bet on the Keenlyside paper’s forecast of 2000-2010 and 2005-2015 being compared to their hindcast of 1994-2004, all of which Real Climate considers wrong.
May 15th, 2008 at 1:02 pm
John V-
As this post illustrates the answer to your question depends upon several factors: time period covered, methods used, and question asked.
1. Lucia has a post up with an important distinction:
http://rankexploits.com/musings/2008/what-is-the-true-weather-noise
“Yesterday, I emphasized that the question I am asking and attempting to answer is:
Q1: Does the IPCC AR4 forecast central tendency of 2 C/century fall within the range of trends consistent with the real earth?
When I use the term “falsify”, I mean it in the sense that the answer to Q1 is “No, 2C/century central tendency forecast is not consistent with the trends observed on the real earth.”
In comments here and at other blogs (like Roger Pielke’s) many visitor often ponder this different question:
Q2: Does the temperature trend experienced by the real earth fall within the range of all trends exhibited by all models used to create the IPCC prediction?”
Please have a look at her discussion of this distinction and why it matters.
2. Here is what I would claim:
A. Using standard statistical test for the differences between two means from normally distributed data, the observational data from all of the groups that keep track of global temperature trends is consistent with the distribution of 2007 IPCC AR4 predictions for the same period at the 95% level.
B. If the time period is extended to the present, this finding does not appear to hold up, certainly, several of the datasets (especially UKMET, RSS, UAH) show a sizable difference between obs and predictions. I haven’t calculated the significance level, but using the test described above I’d guess that it falls between 50% and 95%, so your use of the word “probably” might be fair.
At the same time note that this test is biased in favor of consistency, because it uses a range of uncertainty in the obs which includes historical periods following volcanic eruptions, and 2000-2007 had none. SO a more fair test would probably exclude those years.
C. The period 2001-present presents a case for fairly obvious inconsistency.
Now, we often discuss the importance of not cherrypicking start/stop dates for doing statistics, since one is apt to find whatever they are looking for.
I think that we can agree that using all available data up to the present makes sense, no I won’t dwell on that point.
But where to start?
The IPCC AR4 issues its predictions starting in 2000. So this is the value I used in my Nature correspondence. Lucia has made the case for starting Jan, 2001, as the start of the first calendar year after the prediction is issued. I can see the merit in this as well.
I do not see value in starting in 1998, as some do, mnor do I see value in ignoring data available in 2008 thus far, as James Annan has done.
Regardless, I presented data in this post across these various start dates.
These issues have some subtlety to them and I hope that this answer is responsive to your question, but if not please ask again, and I’ll give it another try.
Thanks!
May 15th, 2008 at 1:07 pm
Lupo- For forecasts to be most useful t people making decisions, low uncertainty, high consistency would be ideal!
May 15th, 2008 at 1:17 pm
Roger, I’ll have to try again.
Let’s focus on 2001 to 2008. You have made two statements:
1. Observations probably agree with model predictions but may be different;
2. Observations are different than model predictions with 95% confidence;
There is no overlap in these two statements. You can not agree with both of them. If you agree with lucia that observations are different with 95% confidence, then you can not also agree that observations are probably the same.
May 15th, 2008 at 1:42 pm
JOhn V-
I don’t think I have said either of these things about 2001-2008, here is what I said in the post about this period:
“Clearly, there is a strong argument to be made that these distributions are inconsistent with one another (and again, even stronger with the satellite data).”
And here is what I said just above:
“The period 2001-present presents a case for fairly obvious inconsistency.”
What do I mean by “inconsistency”?
At a minimum, I wold think that any claim of “inconsistency” would have to at least fail to show consistency at the 95% level. But this is probably a fairly weak threshold. But, say a 50% or less overlap (as seems to be the case in Fig 3 above) seems perfectly reasonable to call “inconsistent”. Do the distributions have to show only a 5% overlap? This errs too far on the otehr side.
“Consistency” is a matter of degree. It is not back or white.
May 15th, 2008 at 1:59 pm
Roger, I said above:
“In this case you might be able to say “inconsistent with at the 25% level” or something like that. That is, there’s a roughly 25% chance that observations do not match model predictions. Or a 75% chance that they do.
If your only argument is that the observations *might* disagree with the models, then you’re right. That means that you also need to accept the converse — that observations *probably* agree with the models. Are you willing to do that?”
To which you replied: “Of course!”
Now you’re saying that the observed trend for Jan01 to Mar08 trend is not consistent with the model predictions. At what level of confidence? Remember that you agreed to 25% above (meaning 75% confidence that observations are consistent with predictions).
The meaning of “consistent with” is generally something like “does not disprove”. You seem to be using it as something more like “proves”. I’m beginning to think your non-standard use of statistical terms is the source of much disagreement and confusion.
May 15th, 2008 at 2:07 pm
If models can only give us an overview of x years or longer as is claimed we need longer for things to smooth out and become meaningful to compare, so any answer from a period shorter is rather meaningless then is it not? Would you call that uncertain?
But is not the real discussion if we can comparing practical matters to abstract maths? Or if we can compare models of forced variability to climate with natural variability?
Roger, I don’t remember James saying the time periods were too short, he seems to be defining consistent as “any overlap regardless of certainty”. Where you seem to be defining it as “enough overlap at a given level of certainty”. It seems for your first graph of the last 96 months as full calendar years your answer is yes, the second graph of the last 96 calendar months maybe, and the third graph of 87 calendar months no.
Although I wonder what event(s) gave us this year’s mean so far (+.35) more like 1999’s first four months (+.39) than that of any year from 2000 to 2007 In the past it’s been volcanos. What now? Natural variability or the failure of greenhouse gases to make a difference or both or something else altogether?
But your question “What observations of the climate system would be inconsistent with predictions of IPCC AR4?”
It seems the answer is observations that don’t overlap with any model or group of them at all over any time period.
John, I think Roger was agreeing the converse would be true, not that 75%/25% was the number he was using.
May 15th, 2008 at 2:11 pm
John V-
You know perfectly well that your initial comment above about “consistency” about was not made with specific reference to the 2001-2008 period. Please don’t play games.
If it is the case that there is a 75% chance that a particular set of observations agree with the models then I reiterate that of course they *probably* match, this is just semantics.
Now for the specific period 2001-present, we can both look at figure 3 above and see that the overlap is not 75%. (Or at east I would hope we can agree on that much!)
I look at figure 3 above and it says to me that there is a good chance that these distributions are inconsistent (lets say at the 40-60% level).
Now if you want to look at those same distributions and say that you see “consistency” at the 50% level, well good for you. We’re saying the same thing.
But as I have written on multiple occasions, if any overlap between a distributions of observations and forecasts is proof of “consistency” (as argued at RC) then we will have reduced the value of such forecasts to just about zero.
May 15th, 2008 at 2:23 pm
Roger, my comment about consistency was absolutely about the 2001-2008 trend. That was the final trend in your post. The one that matters. I’m sorry you misunderstood.
Consistency simply means that there is overlap. The level of consistency depends on the amount of overlap. Consistency is not a difficult test with 7-year trends because of the large amount of uncertainty that must be included in a fair test.
For longer-term trends, such as the 20-year trends shown by Gavin in his RealClimate post, observations must be much closer to predictions to be considered consistent. It would be much simpler if there was not weather noise.
I believe a lot of the uncertainty can be removed by compensating for ENSO, volcanoes, and the solar cycle. Doing so would tighten the uncertainty intervals and make the consistency test for short-term trends more meaningful.
May 15th, 2008 at 2:45 pm
Do politicians and the general public know this? I highly doubt it; otherwise, the thriving polar bears would not have been listed as threatened yesterday. — John M Reynolds
May 15th, 2008 at 2:45 pm
John V-
Here is where we disagree
You suggest — “Consistency simply means that there is overlap”
This is an incredibly weak test of consistency between two distributions (and you still have to define a threshold — 0.1%, 1.0% 5%??)
It means in practice that there is really nothing that would demonstrate inconsistency between obs and forecasts, perhaps otehr than the glaciation of NYC (as one reader suggested) or warming at a rate 10 times that predicted by the IPCC.
You must have very little confidence in climate models to call for such a weak test of their predictive capabilities. I think that we can and should require somewhat more rigorous tests. And on that point I am happy to agree to disagree.
May 15th, 2008 at 2:46 pm
“Consistency simply means that there is overlap.”
Do politicians and the general public know this? I highly doubt it; otherwise, the thriving polar bears would not have been listed as threatened yesterday. — John M Reynolds
May 15th, 2008 at 2:56 pm
Roger,
I explicitly said that the level of consistency depends on the degree of overlap. That is why it’s customary to include a level. If none is given you can assume 95% because that’s what is almost always used. (That is, there is 95% confidence that the results are not incompatible).
“Consistent with” is one of the easiest tests to pass. It does not mean “proves”. It only means “does not disprove”.
Longer term trends (observed and predicted) have smaller uncertainty intervals. The consistency test at a given level is more strict for longer-term trends. You have been given many examples of observed trends that would be inconsistent with predictions over 20- or 30-years.
As an aside, please don’t start quote-mining. That’s one of the lowest forms of debate.
May 15th, 2008 at 3:07 pm
“Consistency simply means that there is overlap. The level of consistency depends on the amount of overlap. Consistency is not a difficult test with 7-year trends because of the large amount of uncertainty that must be included in a fair test.”
Then all that needs to be decided is a number of a reasonable level of overlap for a situation? Given the basis behind the projection and the trend period involved to define the line between consistent and inconsistent? One model and 20 years is not the same as 20 models and one year, isn’t each case of consistent or inconsistent depending on each situation? And is it 1% or 5% or 25% or 50% or 75% or 80% or 95% overlap under that situation make it consistent or not?
10 models and 20 years is a different threshold compareed to 20 models and 7 years. Then what might be the mitigating conditions? It is more helpful to define your criteria first I think.
May 15th, 2008 at 5:18 pm
John V-
My reply stands with with your claim that consistency requires a 5% overlap of distributions. This is, as you say, a weak test.
If scientists started saying things like:
“In a change that does not disprove global warming computer models, the jet streams that govern weather patterns around the world are shifting their course . . .”
. . . instead of . . .
“In a change that is consistent with global warming computer models, the jet streams that govern weather patterns around the world are shifting their course”
then we’d have an improvement.
Of course, what seems to be missed in this discussion is that just as recent trends have gone from being more consistent with IPCC predictions to less consistent with them, future data may very well improve the consistency.
They must become more consistent if the IPCC predictions are in fact correct!
But so long as consistency is questionable it should cause us to question our predictions. This is just good science, and when science is used to inform decision making, good policy as well.
May 16th, 2008 at 7:35 am
Roger,
It is true that a single instance of consistency is not a strong test. The point that I think you are missing is that many consistent observations when taken together make a very strong case.
You seem be to be holding on to the argument that AGW *might* not be a problem. That is also the IPCC position. That’s why they use words such as “likely”, “very likely”, and “more likely than not”. There is still uncertainty in the details but there is great confidence in the core concepts.
When it comes to understanding probabilities I am comfortable believing the climate scientists who understand and know how to apply the appropriate statistical tests. Comparing normal distributions is the kind of thing that’s done in the first month of a first course in undergrad statistics.
No offense, but it’s the kind of thing you should understand before confidently “Comparing Distrubutions of Observations and Predictions”. As you say “some people get very angry” when these sorts of tests are done incorrectly and used to spread disinformation.
May 16th, 2008 at 7:58 am
“It is true that a single instance of consistency is not a strong test. The point that I think you are missing is that many consistent observations when taken together make a very strong case.”
The single instance of consistency that we have been looking at is the temperature trend. That the trend remains consistent does not strengthen the argument if the level of consistency does not change. If the trend continues at, say, the 20% level, then the argument will never become a very strong case.
You can look at other instances of consistency, like the level of CO2, polar ice melt, tropospheric temperature change, sea level change, etc. These should be looked at as well, but first we have to get onto the same page. Roger has been trying to do that by looking only at a single instance of consistency: temperature. We need to sort this out, so people can understand what is meant by consistency. Confusion in that regard has lead people to push politicians to believe the wrong conclusions. People are discussing items with way too much certainty. That is the disinformation. When the models can only be said to be weakly consistent, they are not being proven accurate.
Until this gets sorted out, any information is disinformation. Until this gets sorted out, the debate should remain within the scientific community and not brought to the politicians.
John M Reynolds
May 16th, 2008 at 8:32 am
John V-
Let me respond to a few of your points.
1. You write: “You seem be to be holding on to the argument that AGW *might* not be a problem.”
Absolutely not. AGW is a problem, period. I will put up a post on this, but asking questions about the falsification of forecasts does not say anything about “the problem”. This of course is why this is a sensitive question.
2. You write: “Comparing normal distributions is the kind of thing that’s done in the first month of a first course in undergrad statistics.” You then accuse me of “these sorts of tests are done incorrectly and used to spread disinformation”.
Do you have any issues with how I have compared normal distributions in this post? If so, please explain them. I’ve been very patient in responding to your many comments, and will continue to do so, as long as they are substantive.
You are free to check my bio and see what fields my degrees are in (hint: one is in math).
So if you’d like to argue about the implementation of statistical tests or the philosophy of science in relation to such tests, please do so, but leave the other stuff out, OK?
May 16th, 2008 at 8:43 am
http://upload.wikimedia.org/wikipedia/en/a/a2/Climate_Change_Attribution.png
Does this illustration fairly represent what’s being discussed?
The brown line with the gray range around it is the modeled temperature and range of error.
The black line laid over it is the observed temperature.
Sometimes the observed temperature did fall outside the gray range completely for years at a time.
But doesn’t a statistical analysis have to consider both the range above and below a point for a given time, and also how long the lead or lag time is?
When the observation and the model match as well as they do in that chart, you can see that sometimes the model’s _early_ or _late_ on a particular temperature, as well as being _high_ or _low_ on a particular date.
Considering both, the model’s pretty convincing.
May 16th, 2008 at 8:55 am
Hank, that graph shows historical data. Those are the data to which the models should match quite well. The original post has to do with predictions made by IPCC AR4 from 2000 to 2100 (and beyond for some scenarios). — John M Reynolds
May 16th, 2008 at 9:45 am
I asked if that illustrates the _kind_ of mismatch being discussed.
I realize it’s not possible to illustrate the actual match in the range “2000 and 2100 (and beyond …” yet.
I’m asking how close is close, using that as an illustration of a model and observations where sometimes the observations fell outside the gray area around the model.
Observations may be above, below, before, or after the model. That’s what I’m asking about, this is an example — where the observations, despite missing the gray area in many individual events, fall very close to the model overall.
Not asking for hairsplitting, asking if this picture illustrates the kind of match discussed.
May 16th, 2008 at 9:46 am
Roger,
I apologize if my tone was less than friendly. That’s what I sound like pre-coffee.
I do have issues with the way you compare observations and predictions. The correct way (as you must know) is to use the normal difference distribution:
http://mathworld.wolfram.com/NormalDifferenceDistribution.html
That will give you numeric values for the odds that the observed trend is less than or more than the predicted trend. I believe James Annan has already done the calculation. (You’ll have to check if he’s using your preferred start and end date). He found that the odds of getting the current difference between observed and predicted (if predicted is correct) are roughly 1 in 4.
1 in 4 doesn’t sound very good but you have to consider that this is the worst case based on selectively choosing the start and end date. If you move either date by a few months the trends agree much better. This is illustrated in the three graphs that you used in your post.
May 16th, 2008 at 9:56 am
Thanks John V- I understand the pre-coffee mood;-)
My latest post used the same method as you describe (i.e., used by James). I am not sure that it is correct to use this test, but I used it anyway, and as you report — 1 in 4 results, and I would not criticize someone for claiming “inconsistency” based on this result. The starting date matters.
I question the test because it is not clear to me that treating a bunch of realizations (with a different number from each model) from a bunch of models that are not really independent, with unclear treatment of initializations across the models as a random variable with normal distribution makes sense. We can black box the stats, but I’d prefer not to. James is free to call me an idiot for wondering about this, but trust me, a lot of people in fields from hydrology to economics to philosophy ask the same questions of models in many different contexts.
Maybe in the end James is right and has it all figured out. Good for him. I should be so lucky. But many people see important, unanswered questions on how to treat predictions from various open systems models.
May 16th, 2008 at 11:10 am
John V-
Real Climate links to a useful paper which explains why the overlapping uncertainty ranges are not a good test of significance. It also explains why the approach favored by James Annan, despite the bluster, is not the best one for this exercise.
http://www.gfdl.noaa.gov/reference/bibliography/2005/jrl0501.pdf
Here are some excerpts:
“In climate change studies, a trend estimate may be presented for competing datasets, or for models and observations. When the error bars for the different estimates do not overlap, it is presumed that the quantities differ in a statistically significant way. Unfortunately, as demonstrated
by Schenker and Gentleman (2001, hereafter
SG), this is in general an erroneous presumption.”
The paper found in appropriate use of error bars in asserting significance in a number of paper and in the IPCC TAR. It also says:
“The misperception regarding the use of error bars
may arise because of a fundamental difference between one-sample and two- (or multi) sample testing. For a Gaussian-distributed variate, when only one quantity is estimated, a one-sample test (such as a Student’s t test) may be performed. The null hypothesis would be that the estimated quantity is equal to some constant (e.g., that an anomaly is zero). In the one-sample case, application of a t test is equivalent to placing error bars about the quantity to see if it overlaps with the hypothesized value. However, when the interest is in comparing estimated values from two different samples, use of error bars about each estimate, looking for overlap, is not equivalent to application of a two-sample t test.”
and further:
“In particular, this approach will lead to a conservative bias in that sometimes no difference is found when it should. However, this bias is not constant, varying depending on the relative
magnitudes of the sampling errors in the two
samples. The maximum bias is found when the sampling variability of the two samples is comparable.”
So take from this that (a) overlapping error bars do not convey statistical significance, and (b) the choice of statistical test involves some judgment (i.e., James Annan’s placing of a point representing observations in the distribution of model results and asserting consistency is not the best way to address this issue).
May 16th, 2008 at 1:26 pm
At what point does a mode of transportation move from being safe to unsafe? Not ‘more safe and less safe’ or ‘more unsafe and less unsafe’ or some mix. So at what point does it move from consistency to inconsistency? Then the term can be qualified to the extent of the state.
Are two 75% certain ranges that overlap 50% considered consistent? Two 50% certain ranges that overlap 75% considered consistent? Is it 75/75 50/50 75/95 95/95?
If you can get the wrong answer half the time or more, that would be inconsistent, correct?
The more of the time you can get the right answer the more consistent it is, above 50%. The more of the time you can get the wrong answer the more inconsistent it is, under 50%.
May 16th, 2008 at 1:34 pm
Roger,
I agree that you can’t just check for overlapping confidence intervals. Under the assumption of Gaussian (normal) distributions you have to use the normal difference distribution that I linked above, and that James Annan used in his calculations.
You are basically saying that the standard deviation of the difference is less than the sum of the individual standard deviations. Of course it is. It is however always larger than either of the individual standard deviations.
Therefore, if the mean of one value falls in the confidence limits of the other then you can skip the normal difference distribution. Applying it will only improve the degree of agreement.
May 16th, 2008 at 1:39 pm
John V-
Thanks, but James did not use this statistical test. he compared a single observational trend mean (-.1) to the distribution of modeled trend means.
The tests result in different conclusions:
http://sciencepolicy.colorado.edu/prometheus/archives/prediction_and_forecasting/001431the_helpful_undergra.html
May 16th, 2008 at 1:56 pm
Roger,
If the mean of one value falls in the confidence limits of the other, then it is not necessary to use the normal difference distribution to show consistency. The normal difference distribution will *always* enlarge the confidence intervals and thereby improve the agreement.
What James did was equivalent to assuming the observational trend (-0.1) was perfect. There was no need to extend the confidence limits to account for uncertainty in the observation.
Hopefully somebody with more stats knowledge than I have can comment on your use of an unpaired-t test.
May 16th, 2008 at 2:20 pm
Maybe this can help. Tom C says in a comment over at James’
James -
What you and Roger are arguing about is not worth arguing about. What is worth arguing about is the philosophy behind comparing real-world data to model predictions. I work in the chemical industry. If my boss asked me to model a process, I would not come back with an ensemble of models, some of which predict an increase in a byproduct, some of which predict a decrease, and then claim that the observed concentration of byproduct was “consistent with models”. That is just bizarre reasoning, but, of course, such a strategy allows for perpetual CYAing.
The fallacy here is that you are taking models, which are inherently different from one another, pretending that they are multiple measurements of a variable that differ only due to random fluctuations, then doing conventional statistics on the “distribution”. This is all conceptually flawed.
Moreover, the wider the divergence of model results, the better the chance of “consistency” with real-world observations. That fact alone should signal the conceptual problem with the approach assumed in your argument with Roger.
May 16th, 2008 at 3:23 pm
John V-
You observe — “What James did was equivalent to assuming the observational trend (-0.1) was perfect.”
Indeed, and this is the step that I take issue with. Note that I do not call him names, I simply think that this step is not correct. The existence of 4 other temp trend measures with different values would seem to be pretty strong evidence along these lines, no?
May 16th, 2008 at 3:30 pm
Lupo- Tom C gets it exactly right! Thanks for the pointer, I’ve updated the most recent post with this comment.
May 16th, 2008 at 4:59 pm
> Comparing Distrubutions
Typo…
May 16th, 2008 at 11:19 pm
Roger,
The existence of other observational trends *increases* the uncertainty and *improves* the agreement between model and observation. The assumption of perfect measurements makes the “consistent with” test more difficult to pass.
Since you have a math degree you must know this already.