Lucia Liljegren on Real Climate’s Approach to Falsification of IPCC Predictions
May 14th, 2008Posted by: Roger Pielke, Jr.
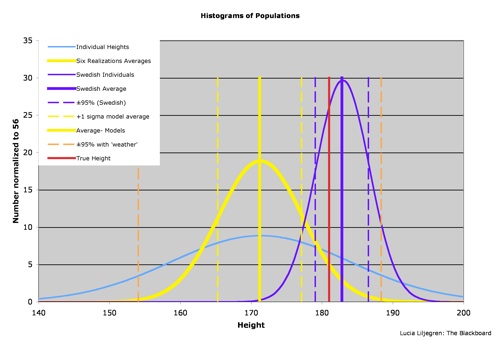
Lucia Liljegren has wonderfully clear post up which explains issues of consistency and inconsistency between models and observations using a simple analogy based on predicting the heights of Swedes.
She writes;
I think a simple example using heights is helps me explain the answer to these questions:
1. Is the mean trend in surface temperature over time predicted by the IPCC consistent with the temperature trends we have been experiencing? (That is: is 2C/century consistent with the trend we’ve seen? )
2. Is the lowest uncertainty bound the IPCC shows the public consistent with the trend in GMST (global mean surface temperature) we have seen since 2001?I think these questions are important to the public and policy makers. They are the questions people at many climate blogs are asking and they are the questions many voters and likely policy makers would like answered.
I think the answer to both questions is “No, the IPCC predictions are inconsistent with recent data.”
Please go to her site and read the entire post.
She concludes her discussion as follows:
The IPCC projections remain falsified. Comparison to data suggest they are biased. The statistical tests accounts for the actual weather noise in data on earth.
The argument that this falsification is somehow inapplicable because the earth data falls inside the full range of possibilities for models is flawed. We know why the full range of climate models is huge: It contains a large amount of “climate model noise” due to models that are individually biased relative to the system of interest: the earth.
It will continue to admit what I have always admitted: When applying hypothesis tests to a confidence limit of 5%, one does expect to be wrong 5% of the time. It is entirely possible that the current falsification fall in the category of 5% incorrect falsifications. If this is so, the “falsified” diagnosis will reverse, and not we won’t see another one anytime soon.
However, for now, the IPCC projections remain falsified, and will do so until the temperatures pick up. Given the current statistical state ( a period when large “type 2″ error is expected) it is quite likely we will soon see “fail to falsify” even if the current falsification is a true one. But if the falsification is a “true” falsification, as is most likely, we will see “falsifications” resume. In that case, the falsification will ultimately stick.
For now, all we can do is watch the temperature trends of the real earth.
May 14th, 2008 at 9:05 pm
When you also take into account that the CO2 emissions have been above scenario A1, the Constant scenario should no longer be considered. The lower error bar should have a definitely positive slope. Estimating from Figure 4 graph from Lucia’s post, I estimate that lower error bar should be 1 degree over 60 years or 0.167 C per decade. The mean for the models then would be well above 0.2 C per decade.
John M Reynolds
May 15th, 2008 at 2:18 pm
Yes, why would we use scenarios that don’t have the emissions correct? What would that prove?
May 15th, 2008 at 7:54 pm
Sly point Lupo.
Including the lesser emission scenarios proves one of, or a combination of, three things:
1. CO2 forcing is not as strong as they figured
2. The feedback is not as strong as they figured
3. They missed one or more forcings that are cooling us even though there have been no major volcanic eruptions since 1992.
This is just my way of saying that without calculating error bars and uncertainties, it seems likely to me that the models have been falsified. Of course, I appreciate all the work people have been doing on this and Lucia’s blog to try to quantify the certainty level of the models. I just wish I had more to contribute to the discussion.
John M Reynolds
May 16th, 2008 at 2:16 pm
Yes John, I have the same conclusions that scenarios with incorrect emissions is an embarassment to notions anything other than sun and water run the weather the weather patterns and the climate. But when you guess and guess and guess a lot so you can get a wide enough range of data to prove anything you should expect to be wrong a lot individuallly and especially with your far out guesses, don’t you think?
May 19th, 2008 at 2:54 pm
This discussion of how one or another emissions trajectory influences results neglects one critical factor: emissions have no direct impact on radiative forcing. It is the atmospheric concentration, i.e. emissions less uptake integrated over time, that matters.
Take a really simple model of the carbon cycle (from Nordhaus’ original DICE model):
dC/dt = a*E – (C – C0)/b
where C is atmospheric carbon, a is .64 and b is 120 years and C0, preindustrial carbon, is 600 Gt. Then whether E is 10 Gt/yr or 11 Gt/yr (i.e. a big difference in emissions) makes less than a 1% difference in concentration over a decade. The impact on forcing, which is logarithmic, is correspondingly tiny.
Thus, regardless of what one thinks about recent temperature, short term deviations in the CO2 emissions trajectory have little effect on the outcome. If some anthropogenic forcing matters, it would have to be one of the short term ones like aerosols.