Homework Assignment: Solve if you Dare
May 23rd, 2008Posted by: Roger Pielke, Jr.
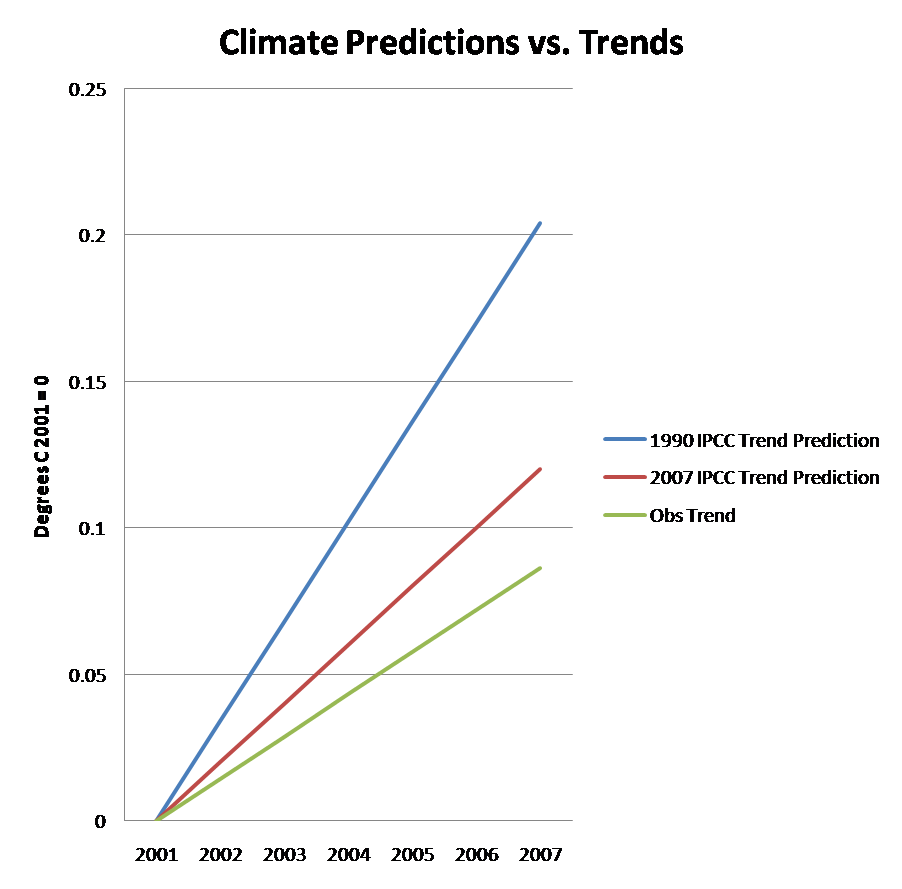
The graph above shows three trend lines.
BLUE: Temperature Trend prediction from the 1990 IPCC report
RED: Temperature Trend prediction from the 2007 IPCC report
GREEN: Observed Trend for 2001-2007 (from average of four obs datasets)
All data is as described in this correspodence (PDF).
Your assignment:
Which IPCC prediction is the trend observed 2001-2007 more consistent with and why? Show your work!
You are free to bring in whatever information and use whatever analysis that you want.
May 23rd, 2008 at 6:31 am
There’s not enough data from 2001-2007 to give an accurate answer.
May 23rd, 2008 at 7:56 am
Roger,
According to my calculations your green line is incorrect. Your green line appears to have a slope of about +1 degree/century. But averaging over the 4 datasets usually used (GISS, HADCRUT3, UAH, RSS) I get a trend of -0.1 degrees per century for 2001 to 2007.
If I include the first 4 months of 2008, this becomes -0.6. So neither of the IPCC predictions is correct, they both have the wrong sign.
However, this shows that Boris has a point – adding a few more months gives quite a different answer. All that can be said is that so far, things are not looking good for the IPCC predictions.
May 23rd, 2008 at 8:21 am
Paul-
Thanks, you are right, thanks for the correction. Spreadsheet error on my part (included some 2000 info).
But, lets let it stand, since it is an idealized question in any case.
Interesting how few comments have appeared so far. Must be a tough assignment!
Boris- Thanks
May 23rd, 2008 at 12:38 pm
Roger, I think you make a mistake in not correcting your graphic. If it is not clear, those who disagree with you make ANY argument possible to contradict or ridicule you.
Just my advice. Another lay man who finds the discussions here interesting. BTW, didn’t Lucia prove it was possible?
CoRev, editor
http://globalwarmingclearinghouse.blogspot.com
May 23rd, 2008 at 1:02 pm
Counter Revolutionary- Thanks, a good idea, the graphic is not in error, only the time period that it claims to represent.
It is an idealized question. I wonder if we’ll get some answers
May 23rd, 2008 at 4:19 pm
Using the average of the start and stop of the trend for the years under question
1928-1947 0
1948-1967 -.025
1968-1987 .065
1988-2007 .39
1998-2007 .50
2003-2007 .55
The start and stop years as an absolute value for the last 5 are .55 and .57 and last 10 are .57 and .57 Everything is around half!
The entire period 1881-2007 is -.4 to .3 a trend difference of +.7 but an average of -.1
Trend min entire period -.4 to trend min .52 for 2001-2007 is a .92 rise or .24 average. Trend max for the entire period .32 and 2001-2007 .57 is a .25 rise or .45 average. Rise in the averages of min to max of .21 or rise of .92 (.0072 per decade) compare to a rise of .25 (.35 a decade)
Do we look at 1881-2007 alone as a trend average of -.1 and 2001-2007 alone as a trend average of .55 with a difference of .65 or an averaged average of .24?
What numbers did you want to throw into the mix now?
So the answers!
It does not matter because the information is meaningless?
The time period is too short to care and so not useful for policy matters?
It’s natural variability?
May 23rd, 2008 at 8:35 pm
Roger:
It seems to me that the whole “consistent with” set of threads have been wrongly targeted.
The central questions are: “Is the ‘flatness’ of the temperature record for the 2001-2008 period evidence that our understanding of the climate processes, particularly as we embed them in GCMs, inadequate at present?” “Is something important missing in our models?” “Is this an important hint that we should reduce confidence in their current predictive skill?”
The observational records of global temperature, (e.g., Gisstemp, NCDC, and HadCRU) are sufficiently consistent with one another, so that the following generalizations will be widely agreed to:
1) Month to month, and year to year noise is quite large.
2) The smoothed trends from 1975 to the present, are upward, at about 2 degrees C per century, with small spread between the individual data sets.
3) The smoothed data from 1880 to 1980, are upward but smaller slope and larger spread.
4) Individual large cooling anomalies are clearly correlated with the known, large, volcanic eruptions, and in accord with expected effects of aerosols.
5) Some warming anomalies seem to be correlated with strong El Nino events (e.g., 1997/1998).
6) If solar cycles are having an effect on these time scales, such correlation is so far hidden in noise.
7) The average global temperature record contains a few ~7-10-year, noisy, temperature ‘flats’ from about 2000 to the present,’ (1905-1915, 1945-1955, 1965-1975 and 2001-2008).
9) All but the latest, have been associated with volcanic cooling (Santa Maria,Helkla, Agung) and/or El Nino type perturbations.
Taken together with the Keeling curve, and what we think we understand of ‘green house effects’, the hypothesis of anthropogenic global warming (AGW) therefore deserves some serious attention.
We have fairly good records (historically and spatially) of ocean-surface temperatures. Not so for the deep ocean. Therefore modeling some ocean fluxes is problematic. We believe we know that large changes in ocean circulation have been responsible for a few, millenial-scale, climate anomalies. We have no indication that any of large magnitude are presently underway. But we don’t know if phenomena as ‘fleeting’ as ENSO, or NAO, can OCCASIONALLY cause especially large transports of surface heat to regions below the mixing layer.
GCMs, are getting more skillful all the time. However they are weak in a number of ways that may contribute to poor predictive skill; resolution, modeling of atmospheric/ocean fluxes and perhaps more importantly, of heat fluxes between surface- and deep-ocean.
If the current temperature ‘flat’ is due to a transitory cooling event (as are volcanic eruptions), due to a ‘burp’ in surface to deep water flux, then we can expect warming to resume shortly, and GCM long-term predictions will probably be trivially effected (even though the GCMs fail to model such burps at this time).
If it isn’t a ‘burp’, but something like the beginning of a long-term change in surface to depth circulation, GCMs predictive skills will be severely compromised until they are appropriately repaired.
This is the problem that requires resolution!
Len Ornstein
May 23rd, 2008 at 9:18 pm
The graphic in the Nature correspondence presents the problem as it ought to be discussed, in terms of absolute temperature anomalies. So, why continue flogging the mathematically and statistically ill-posed trend version of the question?
For extra credit:
- compute the definite integral of f(t) from a to b without reference to f(a)
- compute confidence intervals on X+Y where X~N(0,1) and Y has an unknown distribution
- compute the sum of the following 20 numbers:
8,3,6,4,2,2,7,5
May 23rd, 2008 at 9:29 pm
Why does the time axis of your sea level rise figure (b) start in 1993, when the first assessment Fig. 9.6 sea level trajectory starts in 1990?
May 23rd, 2008 at 9:56 pm
Roger, quite clearly the 2007 IPCC prediction (?) is more consistent with the green line. As to the why, sorry, I don’t know.
However, I keep seeing here and at Lucia’s the argument that a 7 or 8 year period is too short to conclude anything about the validation of the IPCC predictions. Well, I’m not at all sure about that (I am sure that we’d be hearing the opposite if the trend were of opposite sign though). Let me present the situation in a different way (apologies if this has already been done before):
1) The IPCC predicts an average warming of +0.2 C / decade for the first 3 decades of this century, irrespective of the SRES scenario.
2) We’re roughly a quarter of the way to the IPCC tri-decadal prediction (close to the end of the first decade) and we’re observing a ~0 C trend (OLS) or negative (Cochrane-Orcutt).
IMO several conclusions can be immediately derived from this:
a) It’s clearly not impossible that the IPCC prediction will materialize, but for that the warming would have to resume soon at roughly 0.27 C / decade and maintain itself at that very high level for over 2 decades.
b) As time goes on and the warming does not resume it will become increasingly difficult for the prediction to materialize. The subsequent warming trend necessary to accomplish it will become increasingly unrealistic.
c) Weather noise is being posited as the explanation for the lack of warming in this period. This is very problematic. What weather noise? The lack of major volcanoes to account for this lack of warming counts against the IPCC prediction. Solar and ocean cycles are commonly disregarded as important climate factors. More importantly, the very prediction of a constant decadal trend for the first 30 years of the century speaks against the notion of major interdecadal differences in this period, which already are a requisite for the prediction to become true.
Given all the above, I think it makes perfect sense to put in question the skill of the IPCC predictions at this stage. No need to get entangled in semantics over statistical terms or being dragged into an endless analysis of “weather noise”, as if anyone knew how to accurately frame this concept.
May 24th, 2008 at 9:54 am
Len–
Your point seems to be there is warming overall. Roger doesn’t disagree. I don’t disagree.
But that doesn’t mean one can’t ask whether models have predictive skill. When making plans for the future, it’s useful to have an estimate of the magnitude of warming, the uncertainty, and to track whether or not methods of estimating the magnitude are biased.
With regard to your points:
Why do you start your estimate of the trend in 1975, just as the cooling effect of the 1974 Fuego eruption peaks?
Even having selected your starting point during a cooling dip caused by a volcanic eruption, why do you round the OLS fit of 1.8C/century up to about 2C/century?
And having selected a period based on experiments, why leave off the uncertainty in the trend based on the data fit? Using 1979-now data, (the period when both sattelites and land based measurements are available) the 2 sigma is roughly ±0.5C/century (using the method of estimating uncertainties that is decreed as giving “too low” uncertainty intervals by those who don’t like the idea that the IPCC AR4 estimate are off.)
If we account for autocorrelation, the best fit trend for that period was 1.5C/century.
That gives a 95% range of 1.0C/century to 2.0 C/century.
The trend is now flat. On what basis should we conclude the current estimates look skillful?
They may turn out to be– but it’s not looking good.
May 24th, 2008 at 10:16 am
Tom- Thanks, some replies:
1. On sea level the observations start in 2003 as that is when the observational dataset began. Were it to have begun earlier I would have used it.
2. I am presenting trends in this instance because I was told by the RC guys that it is unfair to the IPCC to compare anomalies. Of course, I made no claims of consistency (or not) in the Nature correspondence.
3. You haven’t addressed the homework assignment, or did I miss that?
Thanks!
May 24th, 2008 at 11:25 am
Lucia:
I rounded the trend to one significant digit because I WAS NOT trying to imply great confidence.
I understand that both you and Roger accept the evidence that there has been recent warming.
The important question is whether there will be continuing warming in BAU? And this is AN ‘excuse’ for looking at models. So we’re in agreement on that.
All my ‘flat’ period dates were ’slap dash’; just to roughly pose the nature of the problem.
Obviously models are incomplete. They don’t include any geodynamics related to earthquakes and volcanic eruptions (because no one knows enough to construct such models). They poorly model deep-ocean to surface fluxes for similar reasons. So volcanic eruptions and ocean-flux anomalies are treated as ‘climate noise’. Perhaps some other important physics is also missing (but I personally doubt it).
I’m afraid careful calculation of confidence intervals on temperature trends of the current ‘flat’ and previous, positive ‘up-slopes’ or of model predictions, are not very illuminating WITH RESPECT TO THIS PROBLEM.
‘By inspection’ the current ‘flat’ is an outlier, because obvious ‘climate noise’ seems to be absent in THIS one case; there’s only a very slim chance that this ‘flat’ is merely due to ‘weather noise’.
So none-the-less, some so-far undetected kind of ‘climate noise’, LIKE a large ‘burp’ of cold deep ocean, is to ‘blame’ – or some important longer-term, unanticipated physics is taking control.
In the first case, the GCMs will weather the storm;-) In the second, they’ll require overhaul!
Calculations of confidence intervals on trends will not resolve THIS question.
Len Ornstein
May 24th, 2008 at 1:04 pm
Len–
Is the current trend an “outlier”? Is the previous one? If the real trend is 2C/century, then the current trend is an outlier (if the first error bars I got using a “classic out of the box method”) were right.
But if the real trend is 1.3 C/century or so, neither period is an outlier. They are both entirely expected within the range of weather variability. So, that’s sort of the reason I try to assign uncertainty intervals on everything and see which ideas, models or predictions are consistent.
So, I guess the thing is, I think it’s worth trying to assess how precisely we know everything based on both models and data, and how they overlap.
I agree that calculating uncertainty intervals never entirely resolve everything. In particular, they can’t tell us how, where or why any particular prediction is off. They just point to the idea that something seems awry.
Right now, I’ve been sort of puzzled by a graph of forecasts in the TAR. Why didn’t they include known volcanos in the hindcast? Given the eruptions in 1982 and 1992, if you ‘rebaseline’ and project from 1990, and you left off the veiling due to the volcanos, would you expect the model to underpredict the trend in warming as the dust veil from Pinatubo cleared from the real earth? Wouldn’t you expect to the trend in warming to decrease?
There are so many decisions in those documents that can be puzzling. It may well be the GCM’s are more or less fine, but the problem is related to mis-estimates in the forcings since 1880. A mis-estimate there could easily result in faulty estimates of how much warming is “in the pipeline” at any particular point. Since these calculations move forward in time, getting the wrong amount of heat “in the pipeline” can cause serious problems, even if, otherwise, the physical processes and parameterizations in GCM’s are ok.
May 24th, 2008 at 3:29 pm
Lucia:
We’re basically in agreement.
Len Ornstein
May 25th, 2008 at 12:04 am
Tell me the point of this meaningless exercise! Educated minds know that temperature trends need to be seen over long periods of time to be meaningful. 7 years is a blip on the climate scale.
Instead spend more time sharing science data that is actionable, as for instance:
http://lamarguerite.wordpress.com/2008/05/09/must-read-greendex-international-study-of-consumers-and-sustainability/
May 25th, 2008 at 8:34 am
La Marguerite,
Talk about meaningless exercises, I went to your page and saw first off your quote of the National Geographic scale of “sustainable” countries. I noticed Brazil was #1. Did you know that Brazil is #1 in destruction of tropical rain forest:
http://www.mongabay.com/deforestation_rate_tables.htm
You have to remember you are getting your information from a periodical that increasingly is turning to *selling* than illumination. Same goes for Scientific American etc., and even the gray scientific journals of Science and Nature. The way it I heard it best was “The press doesn’t write about planes that don’t crash”.
Back to the subject at hand, I agree that 7 years is not enough time here. However, considering a few years ago an alarmist guru gave us 10 years “to act” or we’re all gonna die, it seemed like 7 was enough. In fact, the amount of time to determine anthropogenic climate change depends on it’s relative magnitude compared with natural variability. The longer we go like we are (actually cooling this century) the less of an emergency it is, so why panic (and destroy rainforest, starve people to make ethanol, reduce third world countries ability to advance, etc.)
Are you aware that the rate of temperature decline out of the Little Ice Age was the same as the rate of temperature decline out of the Eemian Interglacial? *That’s* climate. 7 years isn’t. Neither is 30.
May 25th, 2008 at 9:11 am
Correction – in that last paragraph, “out of the Little Ice Age” should have been “out of the Medieval Warm Period into the Little Ice Age”.
May 25th, 2008 at 9:27 am
Len,
In your list of nine “widely agreed generalizations” you include one, 4, that is not at all widely agreed upon: the mid 20th century cooling due to (sulphate) aerosols. As it happens, I think it’s the most important of your 9 points. If the reason for that cooling had been anthropogenic aerosols (that is, tropospheric sulphates), the consequences would have been regional and relatively easy to detect. We should also be detecting them now in some Asiatic regions, which we’re not doing. However the cooling was global. According to HadCRUT, the global was actually more pronounced in the SH, which pretty much invalidates your assumption (and hints to undetected causes for climate/weather variability, perhaps including the current flat trend).
Also, you conclude: “If the current temperature ‘flat’ is due to … a ‘burp’ in surface to deep water flux, then we can expect warming to resume shortly, and GCM long-term predictions will probably be trivially effected”. In my previous post I tried to show in an intuitively way why, irrespective of the reason for the current stasis, the particular prediction of +0.2 C /decade for the period ‘00-’30 is increasingly unlikely to succeed. We would have to see a sustained resumption of increasingly high anomalies. It hasn’t happened in the past. It’s also hardly consistent with the very prediction of a stable trend for this period.
May 25th, 2008 at 12:33 pm
Mikel:
I’m not sure I understand your objection.
Item 4 concerns the effects of the aerosols from large volcanic eruptions (much larger than regional human aerosol emissions). Virtually everybody agrees that these events correlate strongly (as the physics predicts) with short cooling spells.
Len
May 25th, 2008 at 2:25 pm
Len,
If your point 4 referred only to volcanoes, then there’s no objection at all.
I was thinking about the ‘large cooling anomaly’ (in the context of the 20th century) of the mid 40s to the mid 70s. Aerosols are also used to explain it, quite unconvincingly, IMHO.
The other objection stands though.
May 27th, 2008 at 5:23 pm
Do I get an A+ for my conclusions?
It does not matter because the information is meaningless.
Or
The time period is too short to care and so not useful for policy matters.
Or
It’s natural variability.
May 27th, 2008 at 5:29 pm
Thanks Lupo, answer sheet will be posted by tomorrow !
Anyone else wanting to answer, get them in ASAP. An interesting lack of named climate scientists participating . . . hmmm;-)
June 1st, 2008 at 9:16 pm
7) The average global temperature record contains a few ~7-10-year, noisy, temperature ‘flats’ from about 2000 to the present,’ (1905-1915, 1945-1955, 1965-1975 and 2001-2008).
9) All but the latest, have been associated with volcanic cooling (Santa Maria,Helkla, Agung) and/or El Nino type perturbations.
What volcanic cooling and/or El Nino type perturbations were responsible for 1945-1955 and 1965-1975?