|
|
|
|
|
|
|
|
|
|
|
|
|
|
|
|
|
|
|
|
|
|
|
|
|
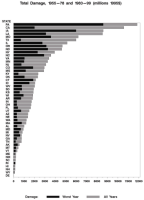
Flood Damage in the United States, 1926-2003 Figure 6-2. States ranked by estimated total damage during 1955-1978 and 1983-1999. (Click on thumbnail image to enlarge image.)
|
|
|
Note: This figure is also available in PDF Format. |

A report of the University Corporation for Atmospheric Research, supported by the National Science Foundation, the National Weather Service, and the National Oceanic and Atmospheric Administration, Office of Global Programs, pursuant to NOAA Award No. NA96GP0451 through a cooperative agreement. In partnership between the Environmental and Societal Impacts Group of the National Center for Atmospheric Research and the Center for Science and Technology Policy Research, Cooperative Institute for Research in Environmental Sciences, University of Colorado.
A report of the University Corporation for Atmospheric Research, supported by the National Science Foundation, the National Weather Service, and the National Oceanic and Atmospheric Administration, Office of Global Programs, pursuant to NOAA Award No. NA96GP0451 through a cooperative agreement. In partnership between the Environmental and Societal Impacts Group of the National Center for Atmospheric Research and the Center for Science and Technology Policy Research, Cooperative Institute for Research in Environmental Sciences, University of Colorado.
