Verification of 1990 IPCC Temperature Predictions
January 10th, 2008Posted by: Roger Pielke, Jr.
I continue to receive good suggestions and positive feedback on the verification exercise that I have been playing around with this week. Several readers have suggested that a longer view might be more appropriate. So I took a look at the IPCC’s First Assessment Report that had been sitting on my shelf, and tried to find its temperature prediction starting in 1990. I actually found what I was looking for in a follow up document: Climate Change 1992: The Supplementary Report to the IPCC Scientific Assessment (not online that I am aware of).
In conducting this type of forecast verification, one of the first things to do is to specify which emissions scenario most closely approximated what has actually happened since 1990. As we have discussed here before, emissions have been occurring at the high end of the various scenarios used by the IPCC. So in this case I have used IS92e or IS92f (the differences are too small to be relevant to this analysis), which are discussed beginning on p. 69.
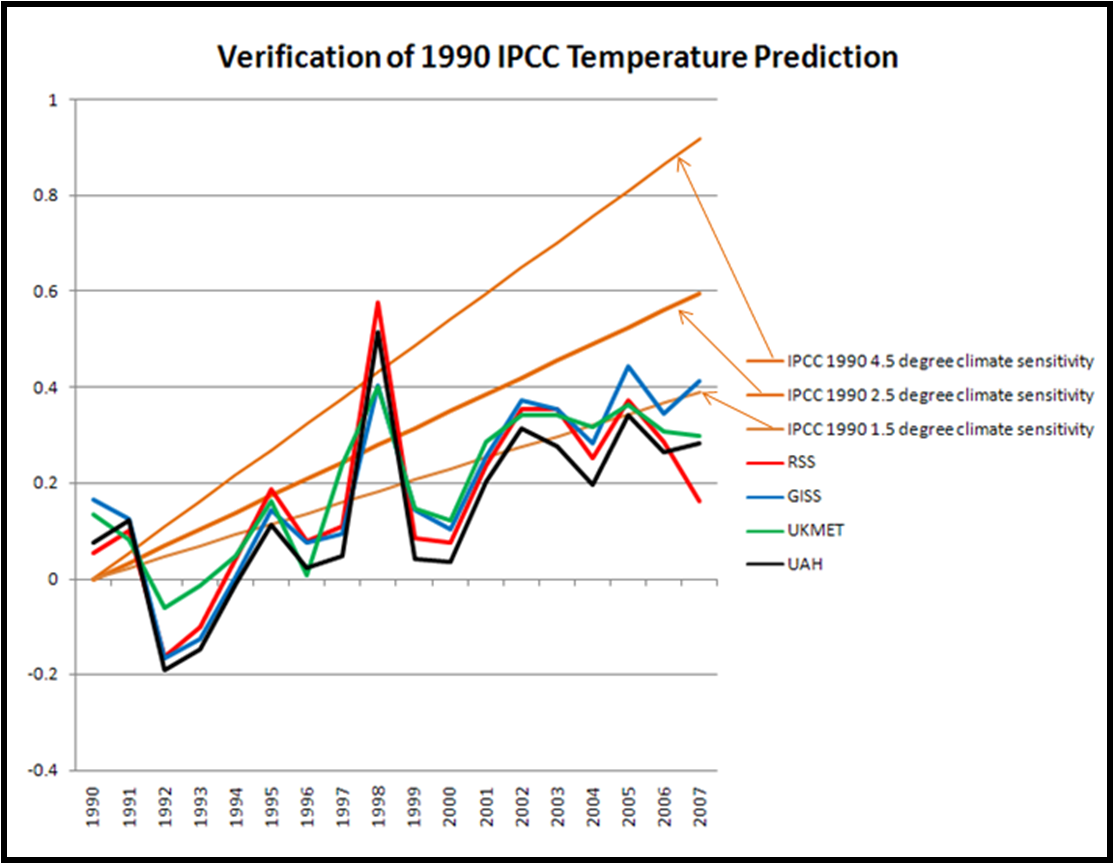
With the relevant emissions scenario, I then went to the section that projected future temperatures, and found this in Figure Ax.3 on p. 174. From that I took from the graph the 100-year temperature change and converted it into an annual rate. At the time the IPCC presented estimates for climate sensitivities of 1.5 degree, 2.5 degrees, and 4.5 degrees, with 2.5 degrees identified as a “best estimate.” In the figure above I have estimated the 1.5 and 4.5 degree values based on the ratios taken from graph Ax.2, but I make no claim that they are precise. My understanding is that climate scientists today think that climate sensitivity is around 3.0 degrees, so if one were to re-do the 1990 prediction with a climate sensitivity of 3.0 the resulting curve would be a bit above the 2.5 degree curve shown above.
On the graph you will also see the now familiar temperature records from two satellite and two surface analyses. It seems pretty clear that the IPCC in 1990 over-forecast temperature increases, and this is confirmed by the most recent IPCC report (Figure TS.26), so it is not surprising.
I’ll move on to the predictions of the Second Assessment Report in a follow up.
January 10th, 2008 at 10:50 pm
Is it really fair to say that the temperature increases were over-forecast? I mean, sure, you can’t argue that the 2007 numbers in the graph above are about 0.3 degrees below the projection.
But what about Pinatubo in 1991? There’s the best portion of the 0.3 degree offset right there; the cooling associated with this natural climate forcing. Volcanic eruptions are stochastic events which cannot be forecast. This is why the IPCC makes projections and not predictions. All the factors known to affect climate aren’t considered in the ‘prediction’ above.
The slope of temperature rise from 1992 onward looks to me to agree quite well with the 2.5 degree sensitivity line. I would argue that that is the more relevant quality to compare here in light of the unexpected forcing, rather than the final offset.
January 11th, 2008 at 1:22 am
This comment sent in by Raven Jade:
“Your latest figure shows the range of IPCC temperature predictions and it is clear that actual temperatures were at or below the bottom end of that range. AGW advocates will argue the data shows that the IPCC was basically correct. I disagree because most skeptical scientists claim that CO2 will cause some warming (around 0.05 to 0.10 degC decade) but this warming is too small to be a concern. This means that any trends in the 0.1 degC/decade range tend to confirm the skeptics view rather than the IPCC view. Especially when the IPCC has states that 3 degC/century is the mostly likely outcome and that trends less that 1.5 degC/century are extremely unlikely.
Richard Lindzen published a number of papers on CO2 sensitivity in the 1990s. I think would be very enlightening to add a Linzden trend line to these graphs so people can visually compare the IPCC predictions to his predictions.”
January 11th, 2008 at 1:49 am
Climate scientist Jos de Laat writes in by email:
“[Y]ou state that “My understanding is that climate scientists today think that climate sensitivity is around 3.0 degrees …”.
Well, that depends. According to a recent study by Petr Chylek and colleagues, see the post below:
http://climatesci.colorado.edu/2007/12/20/an-important-new-paper-on-the-role-of-aerosols-within-the-climate-system-limits-on-climate-sensitivity-derived-from-recent-satellite-and-ourface-observation/
“We find that the climate sensitivity is reduced by at least a factor of 2 when direct and indirect effects of decreasing aerosols are included, compared to the case where the radiative forcing is ascribed only to increases in atmospheric concentrations of carbon dioxide. We find the empirical climate sensitivity to be between 0.29 and 0.48 K/Wm−2 when aerosol direct and indirect radiative forcing is included.”
The range of 0.29-0.48 K/W/m2 has an uncertainty of +/- 0.12 K/W/ m2. For a radiative forcing of 3.7 +/- 0.4 W/m2 by doubling CO2 you get 1.07-1.78 K warming (0.56 – 2.46), if I calculated it correctly. I am not sure what it means for the IPCC projections in terms of warming per decade, but a general accepted number for the climate sensitivity by IPCC was about 0.8 K/W/m2, if I recall correctly (0.8*3.7 gets you your 3.0 degrees climate sensitivity), so I assume you can divide the IPCC-per-decade warming by a factor of 2 if Chylek is correct.
Not that I necessarily think that these type of calculations and climate sensitivity are a very useful concept, but their study shows how these calculations depend on certain assumptions about historical changes of aerosols.”
January 11th, 2008 at 2:58 am
Real Climate has a post up on this topic. They claim that (a) forecast verification of climate models is misguided, and (b) all such verifications support the IPCC. I contest both assertions with a comment. RC has a nasty habit of selectively editing my comments the past few times I’ve tried to participate in discussions over there, so I ask them not to parse my remarks this time. Also I reproduce my comment below.
1. Roger Pielke. Jr. Says: Your comment is awaiting moderation.
11 January 2008 at 10:53 AM
Gavin-
Thanks for this post. There are a few clarifications that you ought to probably point out, and I’d ask that you present my comments in full, rather than selectively edit them.
1. IPCC 2007 issuing a “prediction” starting in 2000, is not really a prediction, since it starts at a time before the prediction is made. As you know, rigorous forecast evaluation begins at the date a prediction is made. Thus, what I prepared and John Tierney showed are simply examples of how a forecast verification is done. In addition, the figure that you point to in IPCC AR4 Chapter 1 really wouldn’t qualify as a rigorous forecast verification (except perhaps for 1990).
2. One way to look at a comparison of models and short-term is as you have and suggest that it is “misguided” because models are based on the longer-term. My view is the opposite — modelers are doing us a disservice by neglecting the short-term. If multi-year and decadal variability is so great as to obscure a long-term trend, then it would be nice to see that reflected in the uncertainty estimates of the models for what to expect over the next 10 years. You run very close to suggesting that climate predictions simply cannot be verified except on a multi-decadal time scale, which I think overstates the case at best, and moves modeling outside the realm of falsifiability, and thus away from the scientific method. Hindcast checks are great, but science aways works better with falsifiable hypotheses on timescales that allow for feedback into the research process.
3. You are incorrect when you assert that “Each of these analyses show that the longer term temperature trends are indeed what is expected.” In fact, IPCC 1990 dramatically over-forecast trends, as show by the IPCC figure that you reference and that I provide here:
http://sciencepolicy.colorado.edu/prometheus/archives/climate_change/001317verification_of_1990.html
There are perhaps good reasons for this like IPCC treatment of aerosols and a subsequent volcanic eruption (but forecast failures always tell us why they were wrong, which is part of their value). IPCC 1995 dramatically lowered its predictions (and as I’ll post up on our blog soon, and had a much more accurate prediction through 2007). But both IPCC 1990 and IPCC 1995 cannot be consistent with observations, since 1995 cut its decadal average trend by 50%.
4. Finally, the IPCC has made many predictions in 1990, 1995, 2001, and 2007. To suggest that comparing the evolution of predicted variables with observations is misguided is itself a strange dodge. There are good reasons to compare models with data, and in fact, your deconstruction of Douglass et al. paper does exactly that. Over the long run, if your believe your predictions to be correct, then a comparison with actual data will eventually prove you to be correct. That there is large variability in the shorter terms simply means a bit larger uncertainty bounds on such predictions. But to avoid forecast verification altogether is a strange position to take.
Thanks again.
January 11th, 2008 at 3:02 am
I just submitted a second comment over at RC:
Gavin- A further comment. Based on your analysis is it fair to conclude that linking the 2007 NH sea ice melt to long-term climate change is equally as misguided as comparing an 8-year record of global temperatures to long-term climate change?
January 11th, 2008 at 4:11 am
“It seems pretty clear that the IPCC in 1990 over-forecast temperature increases, and this is confirmed by the most recent IPCC report (Figure TS.26), so it is not surprising.”
That quote is fascinating to me, for this reason. In essence, it says that “we are aware that actual temperatures undershot a forecast based on a 1.5 sensitivity, much less a 2.5, so in our most recent assessments we have based our forecasts on a 3.0!
January 13th, 2008 at 2:57 am
This is interesting. Your father has promoted the use of ocean heat content as a better metric than surface temperature for measuring and analyzing climate change.
His blog posting here was interesting:
http://climatesci.colorado.edu/2007/12/17/reality-check-2-long-term-sea-surface-temperature-trend-anomalies-and-ocean-heat-content-trends/
Did the IPCC make any predictions about ocean heat content?