Do IPCC Temperature Forecasts Have Skill?
May 19th, 2008Posted by: Roger Pielke, Jr.
[UPDATE] Roger Pielke, Sr. tells us that we are barking up the wrong tree looking at surface temperatures anyway. He says that the real action is in looking at oceanic heat content, for which predictions have far less variability over short terms than do surface temperatures. And he says that observations of accumulated heat content over the past 4 years “are not even close” to the model predictions. For the details, please see for your self at his site.]
“Skill” is a technical term in the forecast verification literature that means the ability to beat a naïve baseline when making forecasts. If your forecasting methodology can’t beat some simple heuristic, then it will likely be of little use.
What are examples of such naïve baselines? In weather forecasting historical climatology is often used. So if the average temperature in Boulder for May 20 is 75 degrees, and my prediction is for 85 degree, then any observed temperature below 80 degrees will mean that my forecast had no skill. In the mutual fund industry stock indexes are examples of naive baselines used to evaluate performance of fund managers. Of course, no forecasting method can always show skill in every forecast, so the appropriate metric is the degree of skill present in your forecasts. Like many other aspects of forecast verification, skill is a matter of degree, and is not black or white.
Skill is preferred to “consistency” if only because the addition of bad forecasts to a forecasting ensemble does not improve skill unless it improves forecast accuracy, which is not the case with certain measures of “consistency,” as we have seen. Skill also provides a clear metric of success for forecasts, once a naïve baseline is agreed upon. As time goes on, forecasts such as those issued by the IPCC should tend toward increasing skill, as the gap between a naive forecast and a prediction grows. If a forecasting methodology shows no skill then it would be appropriate to question the usefulness and/or accuracy of the forecasting methodology.
In this post I use the IPCC forecasts of 1990, 2001, and 2007 to illustrate the concept of skill, and to explain why it is a much better metric that “consistency” to evaluate forecasts of the IPCC.
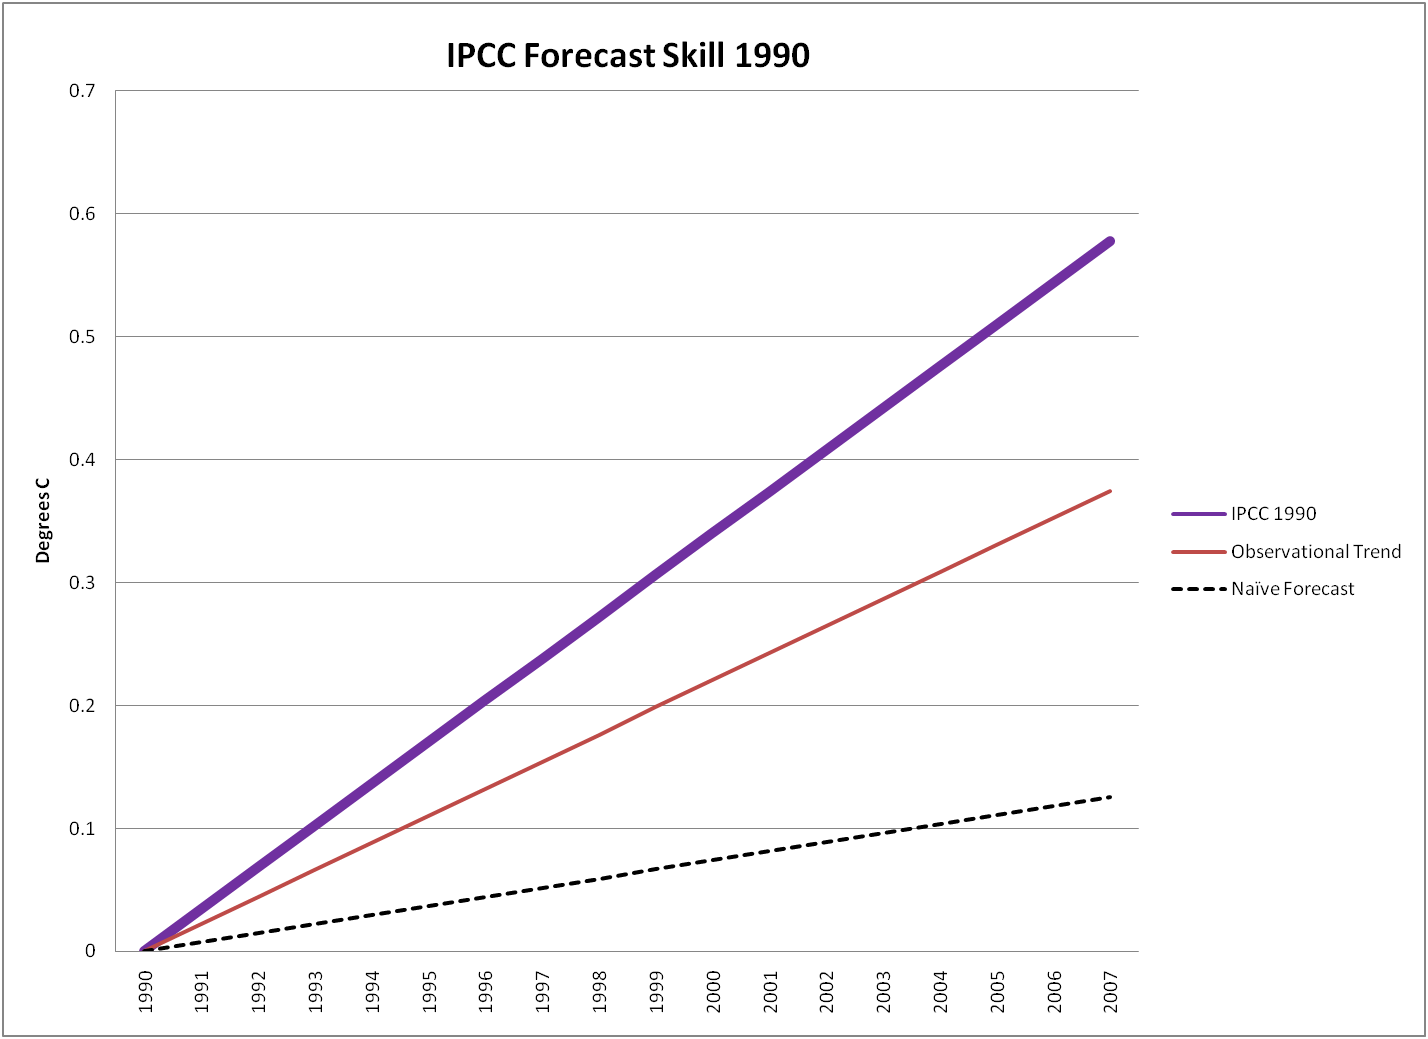
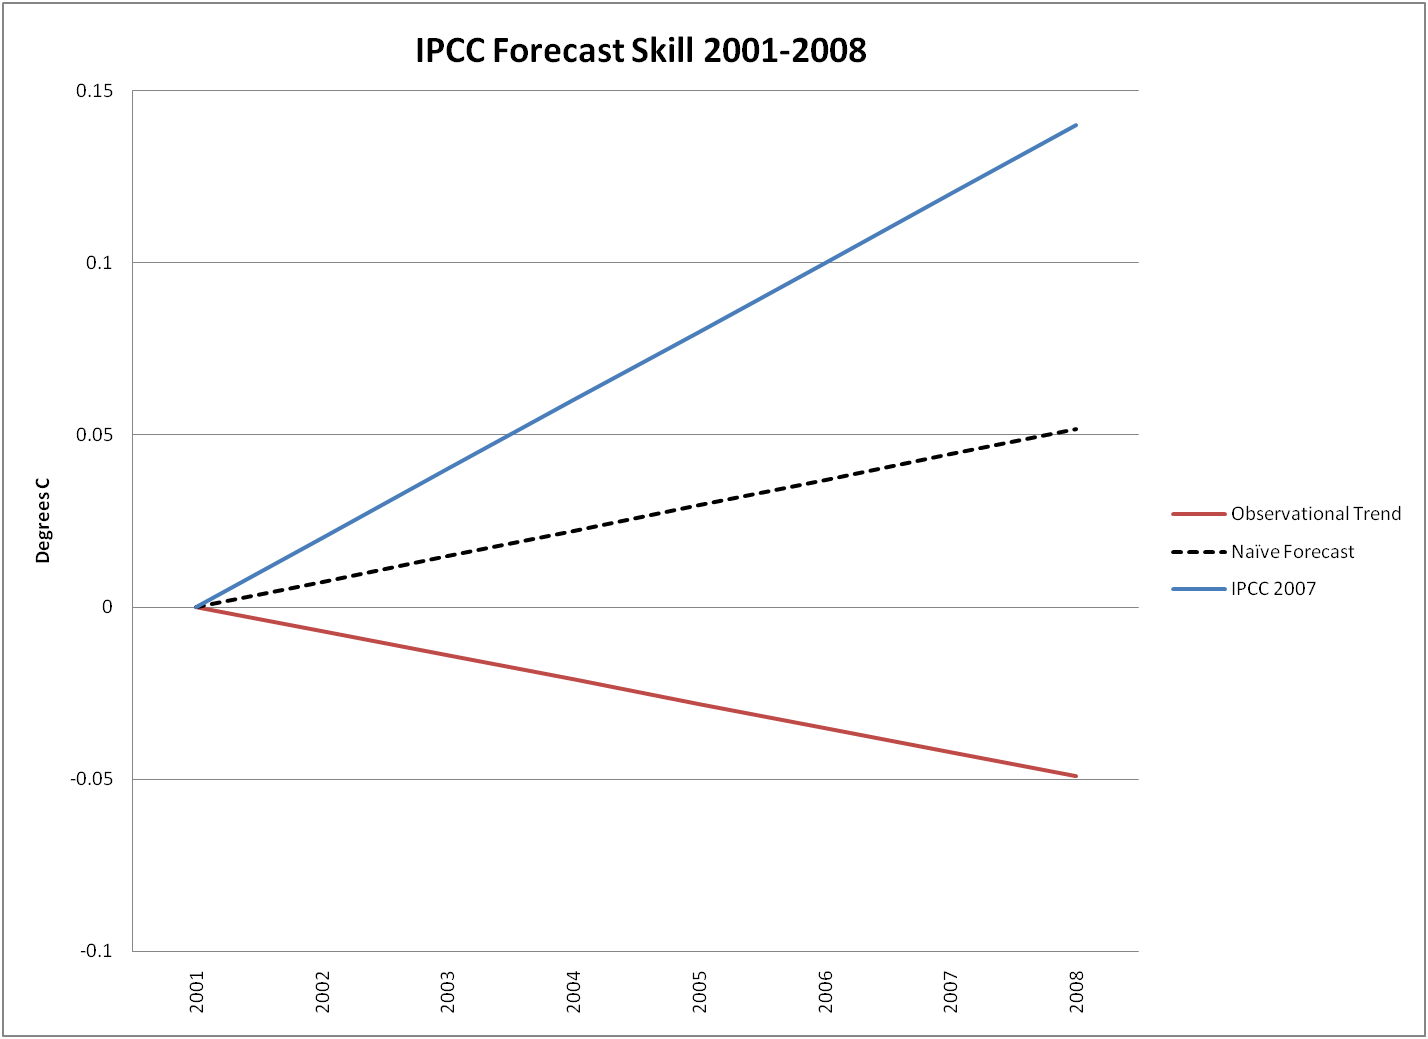
The first task is to choose a naïve baseline. This choice is subjective and people often argue over it. People making forecasts usually want a baseline that is easy to beat, people using or paying for forecasts often want a more rigorous baseline. For this exercise I will use the observed temperature trend over the 100 years ending in 2005, as reported by the 2007 IPCC, which is 0.076 degrees per decade. So in this exercise the baseline that the IPCC forecasts have to beat is a naïve assumption that future temperature increases will increase by the same rate as has been observed over the past 100 years. Obviously, one could argue for a different naïve baseline, but this is the one I’ve chosen to use.
I will also use the ensemble average “best guess” from the IPCC for the most appropriate emissions scenario as the prediction. And for observations I will use the average value from the four main group tracking global temperature trends. These choices could be made differently, and a more comprehensive analysis would explore different ways to do the analysis.
So then, using these metrics how does the IPCC 1990 best estimate forecast for future increases in temperature compare for 1990-2007? The figure below shows that the IPCC forecast, while over-predicting the observed trend, outperformed this naïve baseline. So the forecast can be claimed to be skillful, but not by very much.
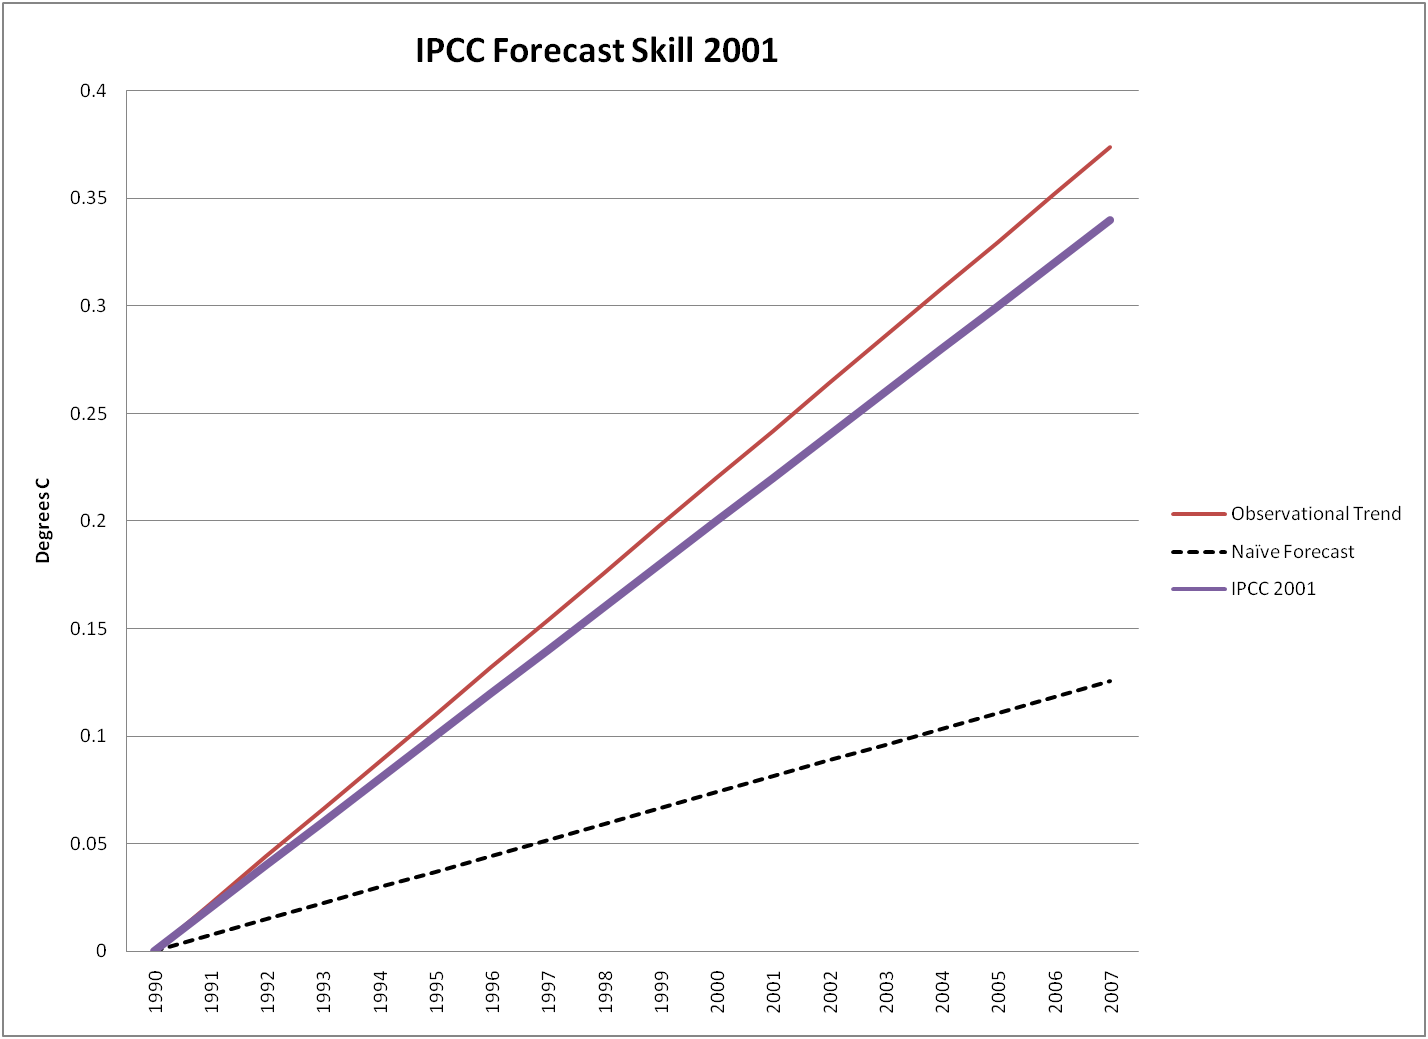
A more definitive example of a skillful forecast is the 2001 IPCC prediction, which the following figure shows demonstrated a high degree of skill.
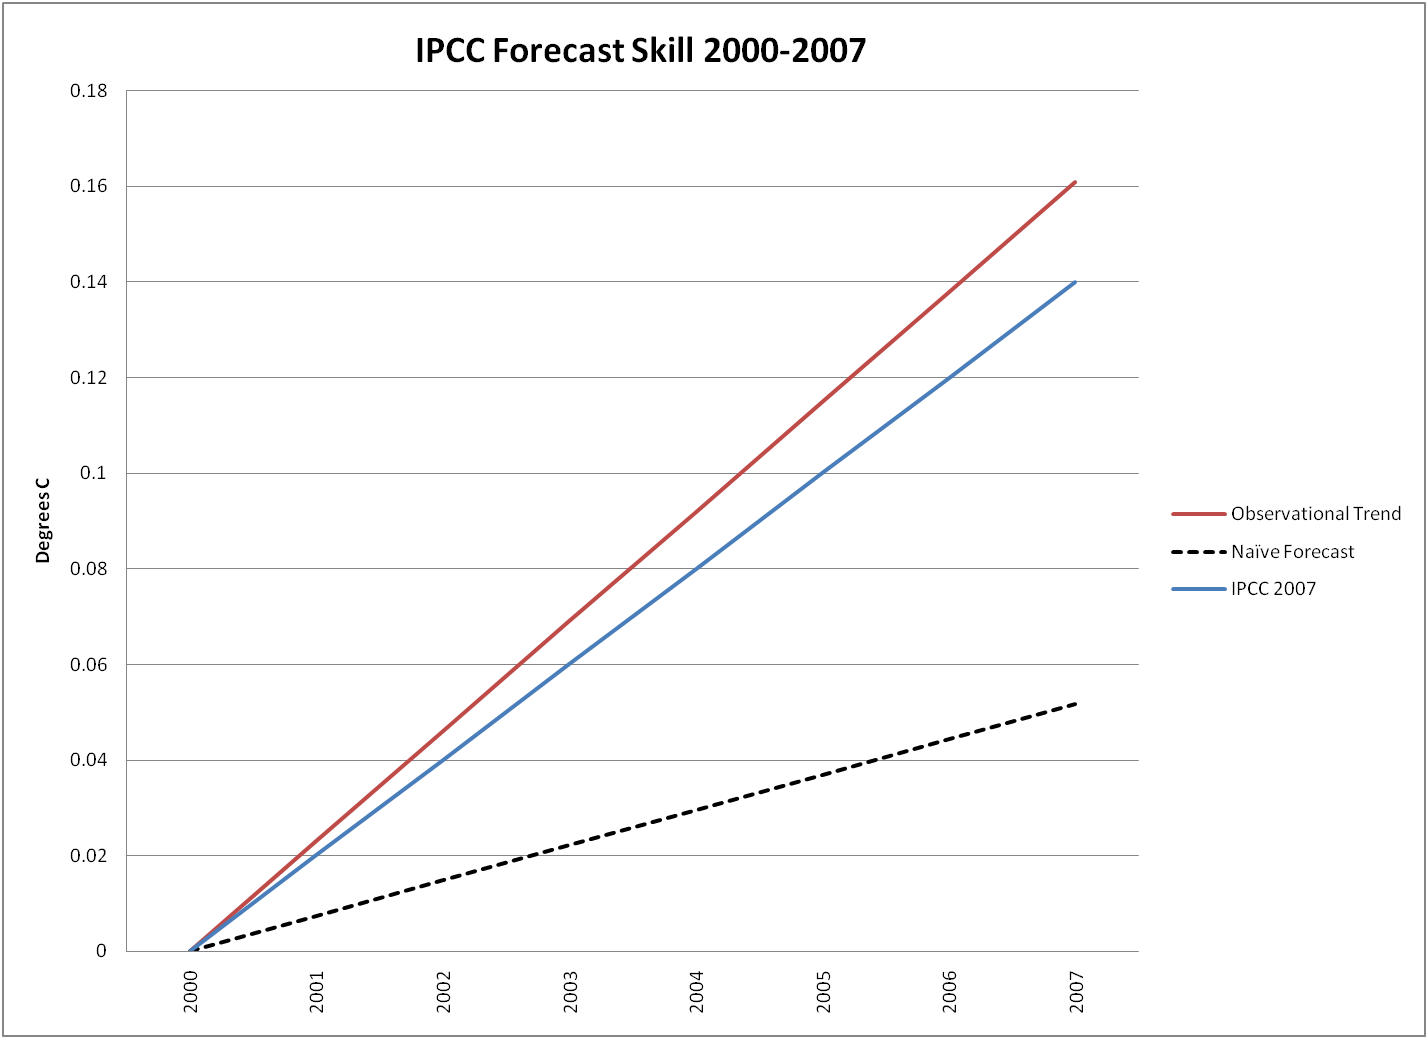
Similarly, the 2000-2007 forecast of the IPCC 2007 also shows a high degree of skill, as seen in the next figure.
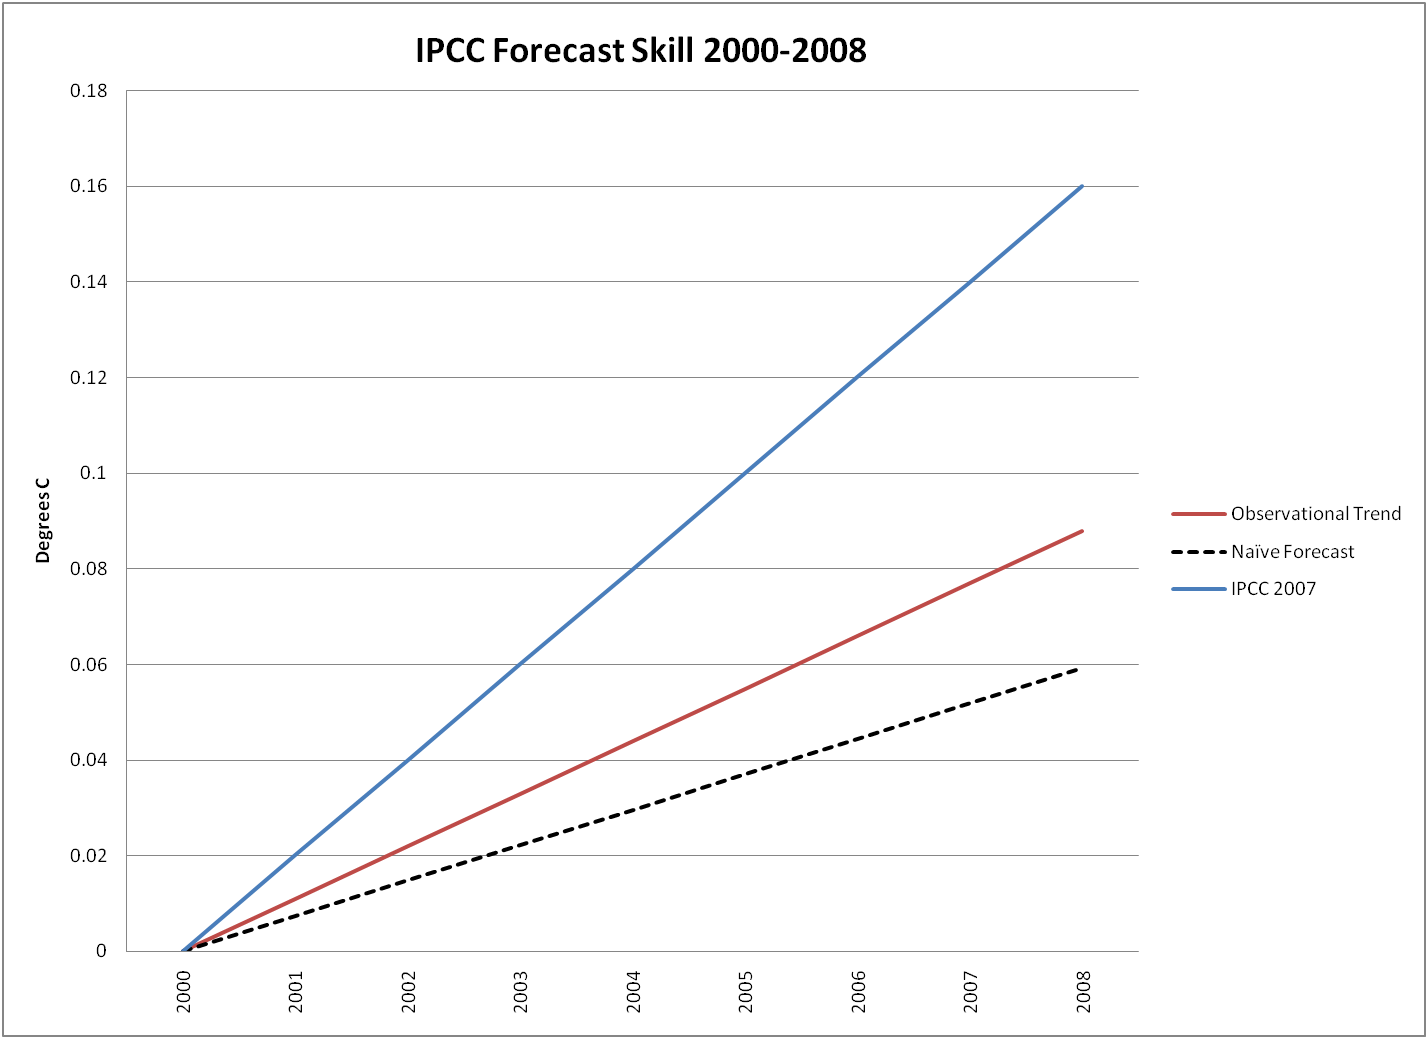
But in 2008 things get interesting. With data from 2008 included, rather than ending in 2007, then the 2007 IPCC forecast is no longer skillful, as shown below.
If one starts the IPCC predictions in 2001, then the lack of skill is even greater, as seen below.
What does all of this mean for the ability of the IPCC to predict longer-term climate change? Perhaps nothing, as many scientists would claim that it makes no sense to discuss IPCC predictions on time scales less than 20 or 30 years. If so, then it would also be inappropriate to claim that IPCC forecasts on the shorter scales are skillful or accurate. One way to interpret the recent Keenlyside et al. paper in Nature is that their analysis suggests that the IPCC predictions of future temperature evolution won’t be skillful unless they account for various factors not included in the IPCC predictions.
The point of this exercise is to show that there are simple, unambiguous alternatives to using the notion of “consistency” as the basis for comparing IPCC forecasts with observations. “Consistency” between models and observations is a misleading, and I would say fairly useless way to talk about climate forecasts. Measures of skill provide an unambiguous way to evaluate how the IPCC is doing over time.
But make no mistake, the longer the IPCC forecasts lie in a zone of “no skill” — which the most recent ones (2007) currently do (for the time of the forecast to present) — the more interest they will receive. This time period may be for only one more month, or perhaps many years. I don’t know. This situation creates interesting incentives for forecasters who want their predictions to show skill.
May 19th, 2008 at 1:14 pm
Alternatively, if the 1-sigma uncertainty intervals based on all realizations are as large as Gavin now describes at RC, it might have been wise for the IPCC to draw their graphic illustrating such wide uncertainty intervals at short time periods. Illustration showing smoothly varying uncertainty intervals that are 1/2 what the public will perceive when experiencing weather may not be the wisest course possible when communicating with the public.
Had the IPCC chosen to interpret the 1-sigma uncertainties as being roughly 2.1 C/century, we would have seen the 1-sigma bounds included a trends that fell below zero in the short term. But, they chose otherwise.
This decision is bound to affect public perception of the skill of the IPCC process.
May 19th, 2008 at 1:33 pm
Roger:
Changing the focus from “consistency” to “skill” might have been helpful. But most algorithms for skill produce a measure which is continuous, with a skill of 0 being one of the limits. So your ‘algorithm’ of skill will only further confuse.
The running discussions, here and on Lucia’s blog, probably tends to confuse all but the most knowledgeable readers (those who have images of the observational data ‘burned in’ their brains).
What both of you are TRYING to do is admirable – if it convinced both the RC crowd, and the rest of us, that a little more care in the use of terms like ‘consistency’, ‘confidence’ and ’skill’ might be in order. But it appears to me that it mainly tends to support the yet unsupportable positions of uninformed and informed deniers.
If you kept illustrations like The GISTEMP graphs:
http://data.giss.nasa.gov/gistemp/graphs/Fig.A.pdf
http://data.giss.nasa.gov/gistemp/graphs/Fig.A2.pdf
http://data.giss.nasa.gov/gistemp/graphs/Fig.C.pdf
at the top of pages like this one, the positive value of ‘eyeballing’ such observational data, and the rather negative value of trying to pass judgments about consistency, confidence or skill for 8-year periods, would remain obvious.
No one who at all understands statistics, would be very interested in assessing ‘matches of’ short-term predictions of models to short-term trends in such noisy observational records with, however, fairly convincing long-term trends. They might only need to be reminded that ALL of these graphs of ‘anomalies’ are plotting differences with respect to the mean temperature of the period, 1880 to 2000.
(To make this post more valuable, it would be helpful if you could insert copies of these three graphs in place of the URLs!)
Len Ornstein
May 19th, 2008 at 2:29 pm
Note: I’ve added an update at the bottom of this post:
http://sciencepolicy.colorado.edu/prometheus/archives/prediction_and_forecasting/001431the_helpful_undergra.html
It illustrates how Real Climate is today arguing that a comparison of model-observation distributions is somehow problematic (on hurricanes, when it doesn’t give the results they’d prefer).
Yet the distributions in question are not much different than those we’ve discussed in this post. Of all the characteristics of “constituency” that we have discussed, to those we should also add “selective.”
May 19th, 2008 at 2:35 pm
Lucia- Great point, are you making up such a figure? I have thought about doing so . . .
May 19th, 2008 at 3:17 pm
Roger–
To make that figure and have it look pretty, it would be best to have the data the IPCC used to make their figure for “projections” along with the uncertainty bands. Then, we could add Gavin’s two 1-sigma estimates to that figure at different times and crayon the rest in. (It would be a cartoon, but at least we’d have the idea.)
We’d only have the 1-sigma for the two time spans
Otherwise, I have to blow up the figures and try to superimpose the dot’s.
There is no reason why the graphic in the IPCC document can’t provide this sort of information. They don’t even need to leave off the other information.
May 19th, 2008 at 3:42 pm
“these graphs of ‘anomalies’ are plotting differences with respect to the mean temperature of the period, 1880 to 2000″
In the case of GISTEMP it is in respect to 1951-1980. Hadley uses 1960-1990 if I remember correctly.
May 19th, 2008 at 3:43 pm
1961-1980
May 19th, 2008 at 4:31 pm
Hi Roger,
You write, “I will also use the ensemble average “best guess” from the IPCC for the most appropriate emissions scenario as the prediction.”
A while ago, you were using A1F1 as the “best guess” for AR4…were you not?
And now, for AR4 (for example) are you using the average of central values for A1B, A1F1, A1T, A2, B1, and B2?
May 19th, 2008 at 4:35 pm
I think you were right the first time, Lupo. Base period of GISS is 1951-80
May 19th, 2008 at 4:53 pm
Hello Ian. I was correcting the 1961-1990 Hadley guess. 1951-1980 is GISS for sure.
On the subject of terminology if the question is like ‘are there any models that match the last 8 years’ the answer could be ‘yes but the spread is too wide to call them consistent with any meaning.’
May 19th, 2008 at 6:21 pm
Thanks Lupo. Sorry for the misunderstanding. But I think your Hadley guess was also right the first time! See pages 8 and 31 of Brohan et al (2006) [linked on the HADCRU page],
May 19th, 2008 at 6:49 pm
Roger, I am intrigued by your comment “Perhaps nothing, as many scientists would claim that it makes no sense to discuss IPCC predictions on time scales less than 20 or 30 years.”
Do scientists actually claim that? If we can’t tell their validity, perhaps we should minimize the amount of funding for models for the next 20 years and put it into renewable energy technology development. Then in 20 years we could test the models, select the best ones, and go about our business. I am quite curious if the concept of “wait 20 years” is actually a widely held view in the climate community.
May 19th, 2008 at 6:53 pm
docpine-
Urs Neu expressed this view on another thread:
http://4dweb.proclim.ch/4dcgi/proclim/en/Detail_Person?28435
It is a common, but not universal view. Of course, the argument is that better models next year will provide better forecasts that we’ll beable to evaluate in 21-31 years
Last week’s Nature contained a plea for more mney for model development.
May 19th, 2008 at 7:33 pm
It seems to me that we are in an essential conundrum, then.
1. Most folks accept we need to do something to avert climate change
2. But doing things is difficult and expensive right now
3. And we need to model to get more details of how things will be (why?) (possibly to encourage to try harder for #2)
4. But those models can’t be verified for 20 years.
My modest proposal is simply to divert funds other than a base level of modeling (I bet we could coast on the rest of the world’s modeling efforts) to directly approaching #2. Intellectual property rights on new technologies will pay off great dividends to the economics of the country. Having famous climate modelers is rather more difficult to quantify in terms of economic benefits. New technologies could possibly generate more jobs than R&D efforts. Perhaps the funding agencies could do an analysis of these different costs and benefits while developing their strategies for research funding?
May 19th, 2008 at 7:47 pm
docpine- Have a look at this paper:
http://sciencepolicy.colorado.edu/admin/publication_files/2003.01.pdf
May 19th, 2008 at 8:55 pm
“1. Most folks accept we need to do something to avert climate change
2. But doing things is difficult and expensive right now
3. And we need to model to get more details of how things will be (why?) (possibly to encourage to try harder for #2)
4. But those models can’t be verified for 20 years.”
I don’t accept that we need to “do something to avert climate change.” During the Medieval Warming Period or the Little Ice Age, when societies were almost infinitely LESS resilient (e.g. far less wealth, far less technological knowledge) people didn’t do anything to “avert climate change.”
I would only agree that we need to do “something” if the climate change is going to be very large (e.g., 4 deg C, 5 deg C, or more) if we do nothing (i.e., don’t get governments involved, and simply progress at the normal pace of energy evolution). And the odds of global warming being 3-5+ degrees Celsius in the next 100 years are virtually zero. (Everyone knows this. Even people like Joe Romm and Mark Lynas.)
Things that we DO need to do something about are:
1) Oil at $126 a barrel, and mostly available from governments that are repressive and undemocratic,
2) Coal that makes an environmental mess when it’s mined (with strict controls for air pollution–even stricter than all but the best facilities in the world–coal air pollution isn’t so bad).
The oil problem is going to solve itself in the next decade or two…because if the price of oil stays the same or even increases, there will be such economic incentives for replacement (e.g. with plug-in hybrids, or biofuels not using food crops) that getting oil out of the ground simply won’t be competitive.
But *those* two are the problems. Not CO2.
As for #2 “But doing things is difficult and expensive right now”…
…the only spot that I see for funding by governments is where there is virtually *no* funding by governments:
1) alternatives to tokamak fusion,
2) better batteries, and
3) photovoltaics.
The real question of modeling (was the change going to be really large, like 3-5+ degrees Celsius) was basically answerable in less than a year. It’s not going to be that large.
So all of the problems that are alleged will be caused by global warming should be dealt with through adaptation:
1) polar bears: artificial ice flows? artificial islands? insulate existing ice each year? kill seals and put them on shore for polar bears to eat?
2) coral reefs: electrical stimulation (soooo cool!)? cool the local water? dump calcium carbonate near the reefs? floating umbrellas?
3) storms: develop portable storm surge barriers (again, soooo cool!)? better evacuation? better zoning to prohibit structures easily flooded?
May 19th, 2008 at 9:02 pm
“But those models can’t be verified for 20 years.”
Wrong wrong wrong. The models already have been verified on their hindcasts for the last century.
May 20th, 2008 at 6:46 am
Mark- could you please explain what a “hindcast” is and how it “verifies” models? If the models are in fact “verified” via this methodology, does that obviate the need for comparing observations with the model and, hence, the discussion above?
May 20th, 2008 at 6:59 am
Mark-
Thanks, I should have said “predictions” not “models”
Model “verification” is an entirely different issue.
May 20th, 2008 at 7:12 am
Sorry if I used incorrect terminology.. what I meant in plain language was “how can we tell if model outputs are likely to be useful enough in predicting real-world conditions in the future make public investments in changing policies and practices at a variety of scales today?” Guess I got confused by the terminology.
May 20th, 2008 at 8:25 am
Hi docpine-
“Use” of predictions is a really complicated issue. We did a whole book on the subject. We developed some criteria for when predictions will be useful in decision making:
1. Predictive skill is known.
2. Decision makers have experience with understanding and using predictions.
3. The characteristic time of the predicted event is short.
4. There are limited alternatives
5. The outcomes of various courses of action are understood in terms of well-constrained uncertainties
Arguably, climate model-predictions don’t meet any of these criteria. This should not be taken to mean that action is unwarranted, what it means is that action is warranted in spite of the limitations of climate models.
Those holding up model-based predictions as justifications for action are not helping their own cause.
May 20th, 2008 at 10:49 am
“Sorry if I used incorrect terminology.. what I meant in plain language was “how can we tell if model outputs are likely to be useful enough in predicting real-world conditions in the future make public investments in changing policies and practices at a variety of scales today?”
Well, one way to start would be to check if the model *inputs* are correct. “Garbage in, garbage out.”
Given that the majority of IPCC scenarios have ridiculous inputs for climate forcing parameters (e.g. methane atmospheric concentrations, SO2 emissions, black carbon emissions) it would be miraculous indeed if their “predictions” turned out to be worth anything.
Except in the same vein that even a stopped analog clock is right twice a day…or a stopped digital clock is right once a day.
May 20th, 2008 at 11:55 am
docpine & Roger -
Even if it were true that all scientists “… claim that it makes no sense to discuss IPCC predictions on time scales less than 20 or 30 years” it wouldn’t necessarily follow that we have to wait 20 years for meaningful verification. The global temperature time series is only a small fraction of the data available for model validation.
Diverting money from modeling might make a meaningful contribution to a field like paleoclimate, but it would be a drop in the bucket in energy R&D.
May 20th, 2008 at 12:31 pm
“3. The characteristic time of the predicted event is short.”
It would seem that no climate model – even a perfect one – could meet this requirement, because there is nothing interesting about short term climate predictions with respect to mitigation decisions. In fact, it would seem that 4 out of 5 of these criteria (all but #1) are limitations of the problem domain, not limitations of models. What then is the implication for society’s management of the problem?
May 20th, 2008 at 1:22 pm
Tom-
“What then is the implication for society’s management of the problem?”
That we cannot expect to know how accurate predictions are as we address this problem. If you are interested in such an approach, please have a look at Steve Rayner’s chapter in our Prediction book (sorry not online!).
People can argue all they wat about how accurate long-term predictions are, and seek proxies for evaluating the likely accuracy, but we won’t know for certain on the time scales of the decision. This means we have to figure out political strategies for action that do not hinge on consensus on predictive accuracy.
The good news is that we do this all the time, such as for earthquakes, which we cannot predict except in a very general sense (they happen where they happen), and many other issues.
It is of course not the fault of modelers that their tool is not well-suited to this political problem.
May 20th, 2008 at 1:55 pm
Roger,
If the models do not provide justification for action (and I agree that they don’t), then what does? Granted, there are many good reasons to seek the development of alternative, clean fuels, but that is not the primary action being put forth as ‘the solution’. Carbon mitigation appears to be the only (political) game in town. What justifies the push towards massive carbon mitigation projects in the absence of the the models? Does the theory alone justify the actions? Are they not (virtually) one in the same?
May 20th, 2008 at 2:17 pm
Jim-
Thanks . . . Theory does indeed (and theory and predictions are not the same). If you add carbon dioxide to the atmosphere it is not a difficult argument to make that it will have long-term effects on the climate system, which includes the oceans and the biosphere.
Now whether we can predict these effects with accuracy is an open question, some think it is closed;-), but it is a different question that whether or not there will be effects.
Now, as Steve Schneider has said, the long-term effects could be relatively benign or they could be pretty nasty. This is where people start arguing about predictions. The IPCC comes down on the side of pretty nasty, but everyone can probably agree that the chances of bad outcomes is not zero.
So given that there are many good reasons to decarbonize the global economy, the risk of nasty outcomes simply adds to those arguments. Adaptation of course requires absolutely no predictive knowledge or additional nasty outcomes for us to get busy (see, e.g., Myanmar or China).
The fact that many advocates for action, including climate modelers, overstate the capabilities of models or do other things not conducive to making a good policy argument, does not mean that those actions that they advocate are necessarily bad ideas. It just means that they are making bad arguments, meaning that the likelihood of taking those actions is reduced when the justifications put forward are more readily disputed.
So I recommend arguing about action, and seeing if we can reach a compromise on where to begin.
May 20th, 2008 at 2:45 pm
“…but everyone can probably agree that the chances of bad outcomes is not zero.”
True, but the chance of good outcomes is also not zero. Many argue that the positive effects will outweight the negative if the overall effect is less than a degree or so of warming. Can we ignore potential positives when deciding to act against potential negatives?
You wrote:
“So given that there are many good reasons to decarbonize the global economy, the risk of nasty outcomes simply adds to those arguments. Adaptation of course requires absolutely no predictive knowledge or additional nasty outcomes for us to get busy (see, e.g., Myanmar or China).”
No argument there, except that the primary action now being sold to the global population is carbon mitigation. I would argue that forced carbon mitigation policies make dealing with Myanmar and China type situations more difficult, causing additional suffering and death than would otherwise occur. I have already heard that the conversion of grains to fuel has created a shortage that was only made worse by the destruction of the Myanmar rice crop, making it more difficult to bring food relief to those suffering. Meanwhile, the net impact on climate from food to fuel policies has been essentially zero!
When it comes to R & D or adaptation, I see win-win. When it comes to carbon mitigation I see lose-lose, unless the warming from increasing CO2 gets above 3 degrees, which seems less and less likely each passing year. So why is carbon mitigation the policy that is getting the political nod, when it has a very high probability of doing more harm than good?
May 20th, 2008 at 3:24 pm
Jim- Thanks, a few replies:
“Can we ignore potential positives when deciding to act against potential negatives?”
No. The good news is that policymaking is incremental, and we’ll be making decisions on this subject continuously for a long time. But just like we can’t accurately predict the negative, we can’t accurately predict the positives either. So for the same reason, decisions will have to be based on something other than reliable knowledge of the exact future.
You’ve said what you are against, but what would you be for?
How about policies to help the developing world modernize their energy systems? If so, where is this energy going to come from? If fossil fuels then it’ll just make everyone’s energy more costly than it already is (including food, transportation, etc.). So would you support an aggressive program to rapidly accelerate and develop and deploy non-carbon-based energy?
If so, how would you pay for it? Say $100B/year? How about a $1/ton carbon tax?
And we could go on like this . . .
Thanks!
May 20th, 2008 at 7:45 pm
Roger,
Here is some fun stuff to mull over.
http://www-pcmdi.llnl.gov/projects/cmip/overview_ms/control_tseries.pdf
control runs.
Comparison of the CMIP2 control run output with observations of the present day climate reveals improvements in coupled model performance since the IPCC’s mid-1990s assessment (Gates et al. 1996). The most prominent of these is a diminishing need for arbitrary flux adjustments at the air-sea interface. About half of the newer generation of coupled models omit flux adjustments, yet the rates of “climate drift” they exhibit (Figure 1) are within the bounds required for useful model simulations on time scales of a century or more. The flux-adjusted models exhibit less drift on average, however, and thus agree better with the limited information we possess on climate variations before the Industrial Revolution (e.g., Jones et al. 1998; Mann et al. 1999). Both flux-adjusted and non-flux-adjusted models produce a surprising variety of time-averaged global mean temperatures, from less than 12°C to over 16°C. Perhaps this quantity has not been the subject of as much attention as it deserves in model development and evaluation.
just start here.
http://www-pcmdi.llnl.gov/projects/cmip/overview_ms/ms_text.php#Fig1Caption
May 21st, 2008 at 5:38 am
“It is of course not the fault of modelers that their tool is not well-suited to this political problem.”
Of course, but would you not agree that they are responsible for promoting their tools beyond their actual capability? And they seem to do so at every opportunity. When pressed they actually do admit to other scientists that the models are not capable of what policymakers are asking for but for the general public and the politicians they show no such restraints.
eg. I recently read two modelers claim in “National Geographic” that last year’s uptick of extreme weather events was predicted by the models. Which is pretty much bare-faced lying: A) they knew very well it was largely attributable to the effect of an el niño at the start followed by a la niña at the end of the year, B) by logic, it must have been cooling that caused these events because that’s what we had, and C) no model is capable of such predictions anyway. The average Nat Geo reader though doesn’t realize they are being grossly misinformed by people they trust.
May 21st, 2008 at 8:42 am
“…This means we have to figure out political strategies for action that do not hinge on consensus on predictive accuracy.”
I agree, but some of your other comments almost sound like, “we can’t deal with climate per se, but luckily there are other correlated short-term problems (many good reasons to decarbonize the global economy) that will coincidentally help us.” It seems to me that to even bother talking about mitigation, one must have a distribution of possible outcomes in mind that is skewed around 0.
We might as well make those assumptions explicit, which means guessing at subjective probability distributions for climate sensitivity or future temperatures. Climate scientists have at least done this; I’m unaware of equivalent well-specified null or naive predictions from skeptics, which means that we’ll never be able to compare skill and get out of the current trap (wait 20 years to decide who’s right).
“The IPCC comes down on the side of pretty nasty, but everyone can probably agree that the chances of bad outcomes is not zero.”
It seems to me that the IPCC, particularly SRES, is rather conservative. Scenarios hardly span the full range of glorious to disastrous futures. No Kurzweil singularity, no Mideast nuclear war over peak oil. Given the track record of long term forecasting, we ought to be seeking a carbon policy that’s robust to huge variation.
“The good news is that we do this all the time, such as for earthquakes, …”
I wish I were so optimistic. Earthquakes are indeed long-term, but there is at least opportunity for learning across regions. Climate provides no such examples.
May 21st, 2008 at 10:43 am
Roger:
The Roger Sr.-motivated “update” makes the point that OBSERVED, recent, Ocean-’surface’ cooling is probably ‘responsible for’ the observed ‘flattening’ of the surface-air, temperature record, and that current GCM modeling of fluxes of heat, from ocean surface to ocean depths, is rather poor.
Current records of temperatures of the deep ocean are much less complete than of its surface. So we can’t yet tell whether the net heat content of the oceans plus atmosphere has none-the-less increased, as ‘predicted’ by AGW.
Does this seriously increase your personal skepticism about AGW?
Len Ornstein
May 21st, 2008 at 11:43 am
Len-
Nope.
“AGW” does not make predictions, models made by people with various assumptions etc. do.
As we have learned an enormous range of states are “consistent with” the models.
May 21st, 2008 at 1:15 pm
Roger,
You asked what I am for. I am for actions that have a high probability of producing benefits in the near future, regardless of how the climate changes. Our present use of fossil fuels can be made cleaner and more efficient. R & D must continue on alternative energy sources and those should be employed where they already make economic sense. This includes nuclear.
I am for improving human adaptability to weather extremes. This includes everything from constructing better buildings and smarter developments to the global adoption of modern farming methods, including crops genetically modified to produce the most efficient yields for a given region.
The only thing I am really opposed to is a global central authority artificially raising the cost of fuel through regulations and restrictions, based on an artificially generated crisis scheduled 100 year from now. History shows use that such central authorities are a very bad idea, prone to corruption and dismal inefficiency, always resulting in a huge increase in human suffering. If this authority proved to be an exception, there is still no discernable benefit from the regulations and restrictions. There would be no way to verify if the sacrifices were ‘worth it’!
There are many things we can do that make sense, but the lemmings are all charging for the cliff of global carbon mitigation, and the things that might really produce significant benefits are being largely ignored.
May 21st, 2008 at 7:51 pm
Roger:
You’re playing ‘word games’.
AGW is a very simple model – but a model none-the-less.
One looks at the Keeling curve. Interprets (and ‘confirms’ by computation) that the almost monotonic increase of CO2 (except for very regular seasonal fluctuations) is due mainly to human burning of fossil fuels. One also looks at the global temperature trend. One then takes into account ‘the greenhouse phenomenon’, and makes the conjecture (model, hypothesis, theory) that a good part of the observed warming trend is a function of (cause of) the anthropogenic atmospheric trend of increasing CO2.
Whether qualitative or quantitative – it’s a MODEL!
Len Ornstein
May 21st, 2008 at 9:09 pm
There seem to be two different discussions going one, one about the accuracy of model predictions, and one about whether accurate models are essential to good policy and research funding decisions.
Since we are mostly or all scientists, I propose an experiment. Let’s sample people who think there may be bad effects but admit we don’t know the magnitude, and people who think that models are a pretty accurate basis for decisions and ask them:
1) What policies do you favor about reducing carbon and adapting to climate induced change?
2) And if you had 100 million to do research to help with climate change what percentages would you fund for what kinds of projects?
In this way, we could empirically test the hypothesis “model outputs matter in terms of policy and desirable research portfolios.” And we could test the sensitivity of different policy options and research portfolios to climate modeling.
May 21st, 2008 at 10:45 pm
My apologies for making a rather strong statement then not hanging around to defend it. I have been out of town (and off the Internet) for a couple of days. I am still too busy to devote much attention to this.
I think models should be verified every way they can be, by comparing their predictions (a very general term, not restricted to forecasts of what will happen in the future) with measurements at every opportunity. So I believe that comparing (say) predictions of GAST from the IPCC AOGCM ensemble in 2001 with measured data since is potentially valuable, but unfortunately (because of the way the predictions are expressed and the variability of the real world) it’s going to take a while until this comparison will give us any additional confidence in the model. Or not: it’s the *possibility* of the model failing the comparison that gives us more confidence when it doesn’t fail. In the meantime, we base our confidence (or not) in the models on the information we already have.
May 22nd, 2008 at 7:02 am
Mark- Thanks.
You write “it’s the *possibility* of the model failing the comparison that gives us more confidence when it doesn’t fail”
The “possibility” of a model failing is exactly the question I seek to answer when I have asked, in principle, “What would be “inconsistent with” the predictions of the models?”
Most (not all) answers suggest that nothing would be “inconsistent with” hence, there is no “possibility” for them to fail.
May 22nd, 2008 at 4:41 pm
Roger: ‘Most (not all) answers suggest that nothing would be “inconsistent with” hence, there is no “possibility” for them to fail.’
We are still talking about 8-year trends in GAST, right? And about model ensembles, not, say, GCMs initialised with real data of the sort that people are beginning to run? Then I (almost) agree with the statement above. Over this relatively short period the models’ predictions are unlikely to fail, even if the underlying models have a significant bias. That’s exactly what I mean when I say 8-year trends in GAST provide a weak test for the models.
May 22nd, 2008 at 6:09 pm
Mark- Right, IPCC AR4, not initialized GCMs. GAST.
But this is still too imprecise for me:
“Over this relatively short period the models’ predictions are unlikely to fail”
What do you mean by “unlikely”?
If 8 years won’t do it, then how long will?
May 23rd, 2008 at 11:43 am
The last 8, 9, 10, 11, 12 and 13 years have a trend of .2 plus or minus .02
Having the same trend is “not warming” wouldn’t you say?
You have to include the “cold” years of 1992-1994 to get to the .2 per decade level.
13 years isn’t “consistent” with .2 per decade – it’s just “not inconsistent”! Wouldn’t that be the way to say it?
That we do not know if it is “consistent” or is “not consistent” , we only know it is not yet shown to be inconsistent. For that we have to wait until a long enough period can be averaged to get us that average per decade, correct? We have undefined, not applicable, lacking skill, or inappropiate time periods.
Why not just say that any readings less than 20 years are in an unknown status?
The argument about 8 years is an interesting one! The last time a period of 8 years had a negative trend slope started 20 years ago, from 1988-1995 at -.03 And flat for 9 years of 1988-1996! I would guess a volcano is involved? If no period of 8 years is sloping down or 9 years is flat without a volcano, and none since 1996 then any period of 8 or 9 years with no volcano should be sufficient, right?
But it is less than 20 years you say! But I say it does show an average of .2 those two year groups, 8 and 9! Just 10% off each group. If it is per decade, is not the last 10 years plus 3 minus 2 in the range of .2? As long as we do not expect it to grow 10% a year every year, it seems that around 8 years is enough? It just jumps at some point in time as the years get longer!
If 2008 keeps as it is going at .35 then since Jan 2000 the trend for 9 years will be .03! That has not happened for over 20 years. And since there was no volcano from 2000 until the figures for Apr 2008 came out, how do you explain it? Where is the greenhouse gas effect the last 9 years all will cry out!