The Curious Case of Storm Surge and Sea Level Rise in the IPCC TAR
June 10th, 2006Posted by: Roger Pielke, Jr.
Earlier this year while I was involved in preparing our contribution to an exchange with colleagues for the Bulletin of the American Meteorological Society on hurricanes, a particular sentence in the response (PDF) to our paper piqued my interest. The sentence read in full:
As summarized in the Working Group II assessment of McCarthy et al. (2001), model projections of the mean annual number of people who would be flooded by coastal storm surges increase several-fold (75–200 million, depending on the adaptive response) for midrange scenarios of a 0.4-m sea level rise by the 2080s relative to scenarios with no sea level rise.
The sentence caught my attention because it was stunningly ambiguous and unclear. What could it mean? So I set out to learn more about it. What I found and my experiences trying to publish what I have found provides some insights into the increasingly curious world of climate science.
The sentence is actually a direct quote from the IPCC Working Group II Third Assessment Report’s Summary for Policymakers, p. 13 (here in PDF). As such it has been widely quoted in the years since the Third Assessment. But a review of how it has been interpreted shows considerable confusion about what it actually means. For example:
A peer-reviewed article in the British Medical Journal came to one conclusion:
“The number of people at risk from flooding by coastal storm surges is projected to increase from the current 75 million to 200 million in a scenario of mid-range climate changes, in which a rise in the sea level of 40 cm is envisaged by the 2080s.”
A report by an oil industry group came to a second interpretation (PDF):
“Even a somewhat conservative scenario of a 40-cm [15.8-in.] sea-level rise by the 2080s would add 75 to 200 million people to the number currently at risk of being flooded by coastal storm surges.”
The Red Cross offers still another interpretation,
“The average annual number of people whose houses are flooded by storm surges along coastlines is expected to increase from a few million each year to between 75 and 200 million by the year 2080, estimates the IPCC.”
Such differing perspectives are chracteristic of this particular bit of the IPCC consensus. No one, it seems, knows what this sentence means. Now this might not be surprising; after all, the IPCC is written by committee and it would not be surprising to see a confusing sentence come out of such a process. However, this is where it gets considerably more interesting. It appears that the IPCC did not explain what the sentence means, and going back to the original scientific source for the statement does not allow one to arrive at a clear interpretation of what it means.
Given that the IPCC is frequently touted as the most highly peer-reviewed document in climate science I found this quite interesting, and somewhat troubling. So I wrote up what I had learned, only to find after months of trying that publishing such a story can be quite challenging.
But before discussing my attempts to publish, let me describe the source of the sentence and the challenges in interpreting what, exactly, it means.
The IPCC WGII SPM points to Section 4.5 of the full assessment report as the source for the sentence. So going to that section, one finds absolutely nothing related to the sentence. However, thanks to Google and the online availability of the IPCC the trail does not end there. Searching on various combinations of “sea level rise” and “storm surge” leads to Chapter 7 of the IPCC which has this passage:
Worldwide, depending on the degree of adaptive response, the number of people at risk from annual flooding as a result of a 40-cm sea-level rise and population increase in the coastal zone is expected to increase from today’s level of 10 million to 22-29 million by the 2020s, 50-80 million by 2050s, and 88-241 million by the 2080s (Nicholls et al., 1999). Without sea-level rise, the numbers were projected at 22-23 million in the 2020s, 2732 million in the 2050s, and 13-36 million in the 2080s. The 40 cm sea-level rise is consistent with the middle of the range currently being projected for 2100 by Working Group I. In 2050, more than 70% (90% by the 2080s) of people in settlements that potentially would be flooded by sea-level rise are likely to be located in a few regions: west Africa, east Africa, the southern Mediterranean, south Asia, and southeast Asia. In terms of relative increase, however, some of the biggest impacts are in the small island states (Nicholls et al., 1999).
Nowhere in this passage is it clear however where the SPM got the 75-200 million number, or what it might mean.
Nicholls et al. 1999 is this paper:
Nicholls J.N., F.M.J. Hoozemans and M. Marchand, 1999. Increasing flood risk and wetland losses due to global sea-level rise: regional and global analyses, Global Environmental Change, 9:S69-S87. (PDF)
And after several careful readings it turns out that all of the questions lead to Table 7 in that paper which I reproduce below.
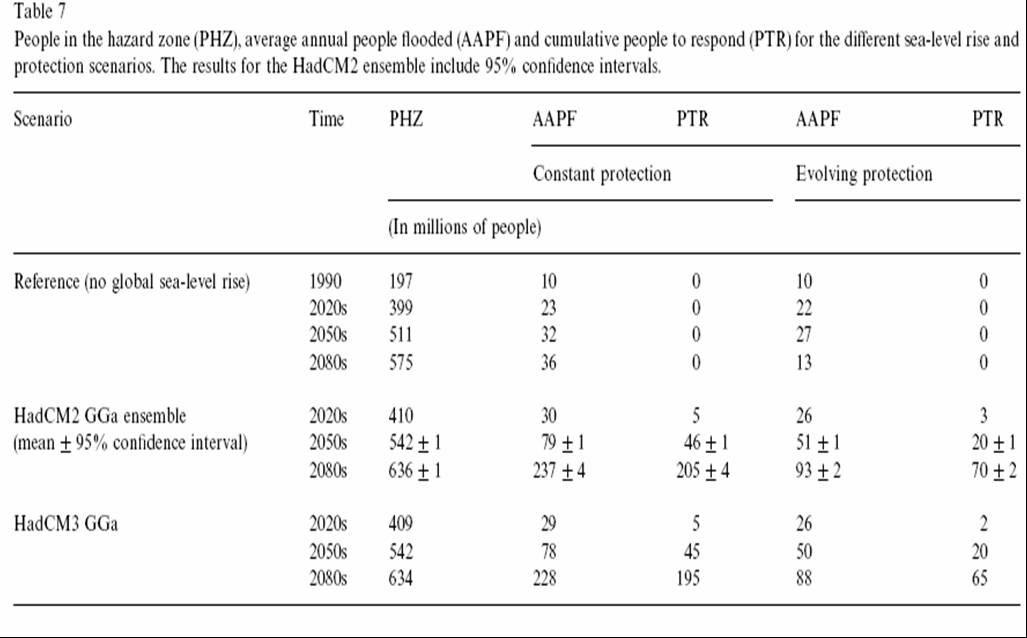
My first reaction was that the IPCC confused the cumulative people affected by a 1 in 1000 year storm surge event (People to Respond or PTR in the Table 7) with the “mean annual number of people who would be flooded by coastal storm” (AAPF in the Table 7) because these numbers — 70-205 million — look pretty close to those in the SPM (75-200 million) and it would perhaps be easy to confuse the last digits. If so then this would be a huge error, conflating a cumulative number with a cumulative number.
So I emailed Robert Nicholls who graciously responded suggesting that there was another possible interpretation that got one reasonably close to the IPCC numbers. That would be taking the Average Annual People flooded under “Evolving Protection” for the 2080s – 88 million – and subtracting the 13 million for the 2080s under evolving protection with no sea level rise, leaving one with 75 million. Very promising.
However, there is no similar calculation that leads to 200 million. The analogous calculation under the “Constant Protection” column is 228-36 = 192 million. One could confuse the different models to arrive at 237(+4)-36 = 205, but this would be an obvious methodological error (comparing across different models) compounded with a typo. And if not a typo why alter the value from 205 to 200? I can’t figure it out.
So where exactly the numbers came from remains a mystery. No one I’ve asked knows the answer. It makes no sense to me that the numbers would be generated through some procedure outside the peer-reviewed literature, as this is outside the scope of the IPCC’s mandate. And there appears to be no logical or intuitive combination of values that result in the values that appear in the SPM from Nicholls et al. Of course, the IPCC is a sprawling document, and the derivation of these numbers may yet be hidden somewhere inside, but I haven’t found them. Maybe there is an obvious or straightforward explanation, but I have not heard it.
OK, so what? The IPCC has a sentence that is confusing at best, and more likely is just nonsense. Nonsense happens, right?
Well, no. When I first searched for information about it last February, I found that the sentence in question has been used in official documents related to climate policy by the Japanese (PDF), Canadian, and British governments. From a follow up search that I just conducted it seems that the UK citation has been superceded, but I am sure that it remains in cyberspace somewhere.
The IPCC SPM is used to justify policy actions on climate change, and thus it would seem pretty important that its information be accurate and understandable. In this case, it appears that neither criterion was met.
So I thought – naively — that this was a pretty interesting story, particularly given that the IPCC is presently in the midst of preparing its fourth assessment, and wrote a short essay describing what I had found – and more importantly had not found — about the SPM sentence and the main report, when compared to the original literature. I have tried to publish at two outlets that one would think might have an interest in the accuracy of IPCC assessments, only to be turned down, quickly in one case because it didn’t fit a category, and after an extremely long delay in the second case with the chief editor explaining to me, essentially, that the emperor’s clothes are really quite beautiful. The case of storm surge and sea level rise in the IPCC WGII SPM seems to be so obviously an open and shut case – the facts are readily available for anyone to examine for themselves – that I admit some considerable surprise at the difficultly in getting it published. But I suppose that is what blogs are for.
Here is how I opened my essay that I wrote last February:
In the children’s game of “telephone” a group of children sit in a circle and someone starts the game by whispering a phrase to the person seated neat to them and so on all around the circle. After enough transmissions a phrase that begins as “five stories” might come out the end as “jive turkey” to everyone’s delight. The game of telephone provides a cautionary tale for producers and users of scientific assessments. The case of mistaken and misinterpreted information about storm surge impacts illustrates the Intergovernmental Panel on Climate Change (IPCC) suggests that the IPCC may have its own “jive turkey” problem minus the delight.
I justified why this issue is important as follows:
The IPCC has great potential to inform policy makers, however its credibility rest on being accurate and faithful to the literature. Errors will inevitably occur, but in this case an error in the IPCC’s most important summaries has been used uncritically in policy documents and academic studies, apparently not having been noticed until now. This problem may be more systemic, e.g., I have elsewhere written about the IPCC’s erroneous treatment of non-peer reviewed studies of the attribution of climate disasters to greenhouse gases (e.g., Pielke, 2005). However broad the problem is, as the IPCC gears up for its fourth assessment report it seems critical to carefully evaluate its procedures for accuracy, and for users of the IPCC to understand the strengths and limits of assessments. There is a more fundamental problem and that is the distilling of complex, nuanced research into one-sentence sound bites that perhaps inevitably cannot accurately capture what is to be found in a lengthy scientific article.
I sought to provide a more accurate summary of Nicholls et al. 1999 than one can find in the IPCC TAR, which in fact leads to conclusions at odds with that distilled by those who have misinterpreted the IPCC sentence. In fact, Nicholls et al. proivide considerable support for the argument tha increasing coasal habitation is a far greater issue than sea level rise when it comes to storm surge (surprise, surprise):
A more accurate summary of Nicholls et al. (1999) would start by observing that the paper used a scenario that had that number of people subjected to 1 in 1000 or greater risk of coastal storm surges increasing from 197 million in 1990 to 575 million in the 2080s without any rise in sea level, due only to population growth and demographic changes. Under this scenarios, with sea level rise (and no societal reaction) the 2085 population-at-risk would be 630 to 640 million. With no sea level rise Nicholls et al. (1999) calculate an increase in the average annual number of people flooded rising from 10 million (1990) to 36 million (2085) with 1990 levels of protection. With protection that evolves as a function of GDP (but not otherwise changed due to sea level rise) the number of people flooded increases only by 3 million, from 10 million (1990) to 13 million (2085), even though population-at-risk increased by 378 million people. This suggests that only 0.8% of the additional people who inhabit the coastal zone by 2085 with a 1 in 1000 or greater risk would on average experience an annual flood. This compares with 5.1% of inhabitants who experience a flood in 1990 based on the assumptions of Nicholls et al.
Putting this together, according to Nicholls et al. (1999) population-at-risk increases by 438 million by 2085 while the average annual number of people flooded increases by 78 million people, from 10 million in 1990 to 88 million in 2085 (and by 3 million, from 10 million to 13 million under the no sea level rise scenario). So the IPCC should have reported that:
Nicholls et al. estimate that of the 438 million additional people expected to inhabit the coastal zone by 2085 with a 1 in 1000 or greater rise of storm surge, about 0.7% – 18% of them, or on average between 3 million and 78 million additional people annually would experience the effects of coast flooding under the assumptions of the sensitivity analysis.
The difference between assuming that only 0.8% of the additional people who inhabit the coastal zone at risk to flooding under a scenario of no sea level rise versus 18% under a scenario of sea level rise results from the fact that the methods assumes an appropriate adaptive response in the first case but not the latter. For instance, to reach the 18% portion requires than many people would move to locations far riskier than they choose to inhabit today. Using the same ratio of people who experience floods to those at risk (i.e., assuming that people adapt where they live according to the contemporaneous risk) as Nicholls et al. use for 1990 (i.e., 5.1%) would suggest an additional 22.3 million people would be exposed to floods with a population increase of 438 million. Using the ratio suggested for 2085 under no sea level rise results in an additional 3.5 million people who experience floods. Nicholls et al. provide no reason to expect that society will be significantly more risk averse in 2085 than today, nor why the presence of sea level rise would change the acceptable risk from a scenario of no sea level rise.
I concluded with some words of caution:
These details for just this one study of storm surge are very complicated and to understand them requires a careful examination of the primary literature. Clearly, what appears in the 2001 IPCC bears only a distant relation to what the original study actually said. For this reason, scientific assessments cannot replace the primary literature, and some thought should be given by scholars to how best to deal with knowledge that is highly simplified through assessment and then recirculated into academic inquiry. Like the children’s game of telephone, this is a recipe for miscommunication, mischaracterization of scientific research, and a foundation of knowledge that rests a few feet above the ground. A more appropriate role for assessments would be to focus more explicitly on the information needs of policy makers and focus attention on a wide range policy options and their possible consequences. Efforts to summarize complex science may not ultimately prove useful to policymakers if they result in oversimplifications and mischaracterizations.
Climate science is a curious business, that’s for sure.
June 10th, 2006 at 3:32 pm
It *is* curious. For example, to go through that entire exercise without once considering whether that 40cm number still holds up is curious indeed. Without having done so, all you’re doing is picking nits with a document that’s nearly history. It does sound perfect for the Journal of Climate Science History, though. Oh, wait, there isn’t one? Well, no wonder you can’t get published.
Also, by way of heading off the obvious question of why this makes any difference, you imply that somehow the 2001 storm surge estimate got implemented in public policy. Where, exactly?
June 10th, 2006 at 4:39 pm
Roger,
My first assumption would be that the number was a rounding off of the difference calculation you eventually get round to investigating. It’s hardly appropriate to pretend that these numbers are accurate to within a million people. But I suppose that wouldn’t have made such a good story.
June 10th, 2006 at 9:31 pm
James-
Thanks. If so (which it may be) then why not tell us in the body of the report? Second, you’d think that the IPCC would be able to get the significant digit thing right, e.g., why round to 200 but not then round 75 to 80? Further, if this is indeed the case, then the IPCC committed a significant methodological error by conflating different models in establishing its range estimate.
But hey, while we’re accepting such sloppiness in the IPCC, why not with estimates of climate sensitivity as well?
Thanks!
June 10th, 2006 at 9:36 pm
Steve Bloom-
If that whole Sierra Club thing doesn’t work out, you might look into a career as an editor of a major scientific journal! I see potential!
(For the tone deaf – This is what is known as a joke;-)
Thanks!
June 11th, 2006 at 12:12 am
Before I got there, I assumed as James did. The reporting error was likely in not dealing properly with the sig figs, and not saying so. A nice little table showing the calc would’ve been good. So, if this is indeed it, (a) it would be good to have official confirmation and a correction in IPCC FAR, and (b) the ensuing policy guideline is fine.
Could you put a metric on the sloppiness? Can you normalise the number of errors by the number of factoids and compare with other publications (perhaps with weights on how egregious the errors are)? The degree of peer review would be aimed at dealing first of all with the magnitude of the document, and then perhaps to lower the sloppiness index. Criticism should be meted out in proportion to this slopiness index.
June 11th, 2006 at 9:06 am
Daniel-
I think that the error is egregious. It is incredibly sloppy and misleading.
And not just whatever error led to the dodgy numbers — but the error in intepretation by the IPCC that necessarily must exist if the issue is indeed significant digits (I’m not convinced that it is sig digits since that is so blindingly obvious, but it is one possibility).
Here is how I see it:
1. Peer reviewed literature says that the sky is blue.
2. IPCC cites peer reviewed literature to claim that because a derived index of greenness can be determined to be between 3 and 6 that the sky is purple.
3. Others cite the IPCC in peer reviewed and policy relevant outlets to indicate that the sky is indeed green.
4. No one know what the index of greenness actually means or how it was dervied, but it is widely cited nonetheless.
But hey, we are just picking nits
June 11th, 2006 at 9:42 am
Yes, I will agree that this error is egregious, but only in the eating of the pudding. The widely divergent interpretations is the fault of the IPCC editors and warrants correction. (I’m fine with picking nits. As evidence, I suggest that point #2 just above is a bit of a strawman.)
June 11th, 2006 at 10:30 am
Yes, you nitpickers should be ashamed of yourselves. You blaspheme the great God IPCC.
Steve B, I wasn’t aware you’re with Greenpeace! How do you like working alongside the nuclear industry? (Not that I have anything against the nuclear industry myself – on the contrary – but we should make decisions based on fact, eh?)
Back to the Bible – erhh TAR, I’m kind of curious, on a couple of fronts, how these numbers (speaking of carelessness?) work:
“Without sea-level rise, the numbers were projected at 22-23 million in the 2020s, 2732 million in the 2050s, and 13-36 million in the 2080s”
It sure would be nice to get the entire TAR in one document.
Anyway, I’m not sure Darwin wouldn’t be at work here anyway. I would think people could get out of the way in 80 years…
June 11th, 2006 at 10:42 am
Daniel- Thanks. We can agree to disagree. When the peer reviewed liturature provides information that indicates that population growth in the region at risk is far more important than the sea level rise itself (with respect to storm surges), and for whatever reason reason the IPCC turns that message around 180 degress, I’d say that is more than a strawman.
June 11th, 2006 at 11:01 am
There’s a miscommunication somewhere, more than just in the TAR. We don’t disagree on the relative importance of sea level rise and social vulnerability to impacts of storm surges.
June 11th, 2006 at 12:19 pm
Daniel-
OK, I was probably unclear. Apologies for the miscommunication!
June 11th, 2006 at 3:52 pm
Steve H., you’re in serious need of a fact checker: 1) It’s the Sierra Club, not Greenpeace, and 2) the fact that one of the co-founders of Greenpeace, who has not been associated with the organization for many uears, subsequently sold out to the nuclear industry says absolutely nothing about the organization’s present stance.
June 11th, 2006 at 6:18 pm
A more recent paper by Nicholls: Coastal flooding and wetland loss in the 21st century: changes under
the SRES climate and socio-economic scenarios. Global Environmental Change 14 (2004) 69–86. FYI.
June 11th, 2006 at 9:19 pm
Whichever. I used to belong to the Sierra Club, until I discovered how much of their income came from urbanites with guilty consciences, and how much they want to keep people out who actually live near the wilds so they can take their annual one week hiking vacation without worrying about their local thuggery accosting them in the middle of the night in the wilds – which, of course, doesn’t happen because their local thuggery doesn’t go with them to rural areas but stays in their urban neighborhood.
So, do you have an office in that really nice multimillion dollar building the “nonprofit” dues paid for in the bay area?
That actually explains a lot about your religious zealotry. No wonder you don’t care about the accuracy of the IPCC’s claims.
June 11th, 2006 at 10:18 pm
Steve and Steve- This is a good subject on which to exchange emails and carry on there. This thread is about IPCC and sea level. Thanks! Roger
June 11th, 2006 at 10:26 pm
Thanks Daniel- I am familiar with this paper (as well as Nicholls more recent work) … it is worth noting that the paper you reference concludes:
“… the role of development pathways in influencing the impacts of climate change needs to be given more attention.”
And also:
“Sea-level rise increases the flood impacts in all cases although significant impacts are not apparent until the 2080s . . . ”
PDF here:
http://www.defra.gov.uk/science/project_data/DocumentLibrary/GA01034/GA01034_2288_FRP.pdf
Thanks!
June 12th, 2006 at 12:55 am
Roger, I followed your analysis more closely and came to some different conclusions, both from my earlier position and from yours. Sorry, it was too long for a comment. See here:
http://getdowntoearth.blogspot.com/2006/06/storm-surge-confusion-response-to.html
I welcome your, and others’, criticism of it. Cheers, Daniel.
June 12th, 2006 at 6:52 am
Daniel- Thanks for the substantive exchange. I posted a lengthly response at your site.
For those who want the high points.
Importantly, we agree that this is not about tribal warfare in the climate wars, but about a couple of academics trying to parse out the IPCC.
IPCC:
Daniel agrees that the IPCC was sloppy (in my words) or failed to communicate (in his words).
Daniel is mistaken when he writes that I see “no way of getting the “75-200” values” — that is not what I was arguing — I can see a number of ways to get those values, each requiring some mistake on the part of the IPCC. I see no way to clearly get those values without making a few undocumented leaps of faith, and on this Daniel would seem to agree.
Sea level rise as described in Nicholls et al. 1999:
We are also disucssing what in fact the primary literature says about the relative contributions of sea level rise and population growth.
Daniel maintains that sea level rise is the factor that drives the greater number of people flooded in the 2080s.
I maintain that it is Nicholls et al.’s assumptions about people encroaching on the sea.
For deials, see Daniel’s site.
http://getdowntoearth.blogspot.com/2006/06/storm-surge-confusion-response-to.html
June 12th, 2006 at 7:27 am
Thanks for the responses. I’m drafting the details for the other site, but a short follow-up here.
The sloppiness in converting 205 to 200 is different, and in addition to, the lax communication that has allowed the original sentence to be variously interpretted. Two errors here, not just one.
Appologies for implying you have “no way” of getting the numbers, but rather a best guess, like mine, both of which warrent verification.
Cheers, Daniel.
June 12th, 2006 at 11:36 am
“So, do you have an office in that really nice multimillion dollar building the ‘nonprofit’ dues paid for in the bay area?”
To keep this on-topic while still being able to point out that Steve H. is making things up again, I will simply note that the building in which the Club *rents* space, being nearly at sea level, will be very much subject to the consequences of sea level rise and storm surge in the next century, absent a huge investment in dikes.
June 12th, 2006 at 3:41 pm
Interestingly, last night I received an email from the chief editor of the second journal that I submitted my essay to aplogizing for how it was handled.
He still didn’t provide the peer reviews, which in all my publishing has never occurred before.
June 12th, 2006 at 8:25 pm
Unbelievable.
1) As Steve Hemphill notes, one would think with >80 years of warning, people would know enough to get out of the way. (What in the world do we a satellite constantly measuring sea level if no one is going to use the information?)
2) Given the fact that both the Netherlands and Venice have movable sea walls, one would also think technology 75 years into the future would be sufficient to assure that *fewer* people would be flooded. (A few years ago, the Cape Hatteras light house was actually moved intact several hundreds yards further inland. I wonder if anyone in 1799 or 1899 would have imagined that as being possible.)
I wonder if the people who spend many months coming up with such absurd analyses actually really think that no one will notice that the sea level is constantly rising in the next 80 years? And do they really think that technology will somehow freeze in place at year-2000 levels for the next 80 years?
June 12th, 2006 at 8:43 pm
Roger,
This is OT for the thread but I was wondering if you were going to express an opinion in an upcoming post on NOAA’s recent public statements about the upcoming hurricane season, specifically, the conspicuous lack of any mention of a possible global warming connection while presenting the natural cycle position as a fait accompli.
Given your recent taking to task of the NYT I would expect that. If you have no such plans, perhaps you can tell me why my expectations are misplaced!
Thanks.
June 12th, 2006 at 9:14 pm
Coby- Thanks. Didn’t we beat this dead horse already during the last few months? But if there is something new from NOAA I haven’t seen it yet, so send me a link and I’d be glad to offer my thoughts;-)
June 12th, 2006 at 10:26 pm
Mark, the technological capacity of societies to adapt differs greaty between developed and developing nations. We will collectively develop better technologies, but countries like Bangladesh could not match the efforts of the Netherlands. It is in developing nations that population is and will be the greatest, as well as there that people are least able to relocate away from the coast. Though, given the inertia to remain in New Orleans, I see no tangible willingness yet, even among the wealthiest of nations, to move away from unsound locations.
June 13th, 2006 at 8:54 am
Hi Roger,
I was thinking of this:
http://www.noaanews.noaa.gov/stories2006/s2634.htm
which I saw via RC’s latest post
http://www.realclimate.org/index.php/archives/2006/06/noaa-apres-moi-le-deluge/
also a commenter referred to a 2005 summary
http://www.realclimate.org/index.php/archives/2006/06/noaa-apres-moi-le-deluge/#comment-14583
that apparently takes the same AMO only position (caveat: did not check this myself)
http://www.cpc.noaa.gov/products/outlooks/hurricane-archive.shtml
This may have been thouroughly discussed before, I am relatively new to your blog, (unlike ‘normal’ people, I tend to enter the room asking questions and making comments rather than respectfully lurking for the proper length of time however my recollection is that this issue was left as “problem fixed”, which may have been premature.
June 13th, 2006 at 10:55 am
“We will collectively develop better technologies, but countries like Bangladesh could not match the efforts of the Netherlands.”
What do you think the per capita GDP of Bangladesh is going to be in 2080 (in year 2000 dollars)? What do you think will be the world average per capita GDP in 2080 (again, in year 2000 dollars)?
“It is in developing nations that population is and will be the greatest, as well as there that people are least able to relocate away from the coast.”
Which is harder to relocate away from the coast…the Empire State Building or a bamboo hut? A key question about how hard it is to relocate away from a coast (ignoring the possibility of development of technology to move structures away from the coast intact) is the “half-life” of the structures. That is, how long does it take before half the structures are replaced? This is important, because when a structure is replaced, it can be rebuilt farther away from the shore. I don’t know this for a fact, but I would be pretty shocked if the “half-life” of bamboo huts was longer than the half-life of skyscrapers. Therefore, it should be easier for people in Bangladesh to move away from coasts.
http://banglapedia.search.com.bd/HT/A_0293.htm
“Though, given the inertia to remain in New Orleans, I see no tangible willingness yet, even among the wealthiest of nations, to move away from unsound locations.”
Do you think that the same storm as Katrina would result in the same number of people in New Orleans being in “unsound locations” 20+ years from now?
June 13th, 2006 at 12:24 pm
Hi Coby-
Thanks for these links. I wouldn’t be too worked up about the NOAA seasonal prediction not mentioning global warming, though they very easily could have linked to the WMO statement if they wanted to be preemptively defensive.
The reason for my not being too worked up is that global warming is not a factor that NOAA includes in their seasonal prediction methodology (and I am unaware of any peer-reviewed studies that link global warmingt to seasonal prediction), so it only makes sense in their description of their forecasts they explain the methodology as they apply it.
Now the methodology may be scientifically flawed, and if so, the route for RealClimate would be to show how it is flawed and provide an alternative forecast and methodology. But simply complaining about the lack of “acknowledgement” without explaining why it makes a difference in the seasonal forecast seems misplaced. NOAA doesn’t discuss coastal development either, but I’m not complaining. Its a seasonal forecast, not a Christmas tree.
I’d further note that NOAA provides forecasts for the Eastern and Central Pacific and in both cases is predicting a lower-than-average season (according to their same methodology). Here as well they could have linked to the WMO statement, I suppose. But what role does the global warming linkage have in these forecasts?
Criticizing NOAA for the 2005 seasonal forecast is extremely unfair as papers by Emanuel, Webster et al. etc. all were published after the forecasts were produced.
Bottom line: If NOAA seasonal forecasters wanted to preempt the sort of criticism they get from RC then yes, they could have linked to the WMO statement for a consensus perspective on global warming and hurricanes. But given that it is unclear what, if any, significance that the global warming studies have for seasonal prediction, I am not too concerned that it wasn’t mentioned in this context. NOAA similarly does not mention global warming in its forecasts of the tracks and intensities of particular hurricanes.
If Real Climate wants to explain why it matters that global warming be considered as a factor in seasonal predictions for the NATL, EPAC, and CPAC, I’d love to hear it. If it matters for the forecast, then they’d have a much stronger case I believe.
Thanks!
June 13th, 2006 at 2:49 pm
Mark
Once again I am left in awe of the craftmanship with which your optician assembles your rose lensed spectacles )
)
Surely if you are going to cite the banglapedia page for construction techniques you should also investigate the same source’s view on flooding?
http://banglapedia.search.com.bd/HT/F_0103.HTM
My particular favourite (ironic) is a selection from the list of historic events:
“2000: Five southwestern districts of Bangladesh bordering India were devastated by flood rendering nearly 3 million people homeless. The flood was caused due to the outcome of the failure of small river dykes in West Bengal that were overtopped by excessive water collected through heavy downpour.”
One assumes this displaced population were really counting their blessings that their homes weren’t constructed more substantially? (irony)
Another educational quote from this page is:
“During severe floods, the affected area may exceed 55% of the total area of the country.”
Sort of limits the potential to move away and build somewhere else I’d suggest.
But then, perhaps everyone could just squeeze onto the remaining 45% of land in order to extend the “half life” of their family ‘pad’ toward the 62.46 years of life expectancy?
Well, considering the description of the national situation as described here:
http://www.cia.gov/cia/publications/factbook/geos/bg.html
“…many people are landless and forced to live on and cultivate flood-prone land; water-borne diseases prevalent in surface water; water pollution, especially of fishing areas, results from the use of commercial pesticides; ground water contaminated by naturally occurring arsenic; intermittent water shortages because of falling water tables in the northern and central parts of the country; soil degradation and erosion; deforestation; severe overpopulation”
…perhaps that might not be as easily achieved in the foreseeable future you’d have us believe?
But, then they could always build levees with the wealth you’re predicting for them…but, No… they don’t work when based in deltaic sediment…do they!
Hugh ;o)
June 13th, 2006 at 9:31 pm
Roger,
You repeated a few times in your response to me (thanks for that) that a GW signal is not a factor in a seasonal prediction. I have no doubt you are correct. I take it from this that the AMO cycle *is* a factor that NOAA includes in their seasonal prediction methodology. Can you point me somewhere where I could see that?
Because if not, I’m afraid you may have a serious blindspot and I am sure that is something you try hard to avoid judging from what I have read from you.
From that page ( http://www.noaanews.noaa.gov/stories2006/s2634.htm ), the only relevant passage is this:
“Warmer ocean water combined with lower wind
shear, weaker easterly trade winds, and a more
favorable wind pattern in the mid-levels of the
atmosphere are the factors that collectively
will favor the development of storms in greater
numbers and to greater intensity. Warm water is
the energy source for storms while favorable
wind patterns limit the wind shear that can
tear apart a storm’s building cloud structure.
This confluence of conditions in the ocean and
atmosphere is strongly related to a climate
pattern known as the multi-decadal signal,
which has been in place since 1995.”
It doesn’t really suggest that this AMO pattern is a factor in their prediction, rather it is a factor in producing the confluence of conditions apon which they base their predictions. Again, you may have some information I don’t, this is *very* little to go on.
But assuming the absence of this AMO as input into the model, we are left with a reference to warmer waters, which certainly are a GW issue.
Given the legitimate scientific case that can be made for a connection between strong hurricanes and GW, I think NOAA is doing the public a grave disservice by this omission. Given the heated nature of this debate, I also think it is more than likely this was a very delibrate omission.
Given the way you take scientists to task for inappropriate political behaviour where science interfaces with the public, I would think that this would bother you.
Of course the above is much weakened if in fact AMO cycles are an input into the seasonal prediction methodology. It would not be enough to sway my personal opinion, but it would weaken the case enough that I would have no trouble accepting that this does not pique your interests.
Thanks for your attention.
June 13th, 2006 at 9:36 pm
“Once again I am left in awe of the craftmanship with which your optician assembles your rose lensed spectacles )”
)”
The main difference between me and most people talking about 21st century economic growth is that I actually know what I’m talking about.
What do you think the per capita GDP in Bangladesh and the world will be in 2080?
June 13th, 2006 at 9:48 pm
Coby-
Try this:
“The predicted 2006 activity strongly reflects an expected continuation of conditions associated with the multi-decadal signal, which has favored above-normal Atlantic hurricane seasons since 1995. These conditions include considerably warmer than normal sea surface temperatures (SSTs), lower wind shear, reduced sea level pressure, and a more conducive structure of the African easterly jet.”
and
“Over the North Atlantic, key aspects of the multi-decadal signal expected during the 2006 hurricane season include 1) warmer SSTs, lower surface air pressure, and increased moisture across the tropical Atlantic, 2) an amplified ridge at upper levels across the central and eastern subtropical North Atlantic, 3) reduced vertical wind shear in the deep tropics over the central North Atlantic, which results from an expanded area of easterly winds in the upper atmosphere (green arrows) and weaker easterly trade winds in the lower atmosphere (dark blue arrows), and 4) weaker easterly winds in the middle and lower atmosphere, resulting in a configuration of the African easterly jet (wavy blue arrow) that favors hurricane development from tropical waves moving westward from the African coast.”
Have a look at the whole page here, which also provides citations to the peer reviewed literature on which their forecasts are based, and where you can find out exactly how they produce the forecasts:
http://www.cpc.noaa.gov/products/outlooks/hurricane.shtml
And it is not just NOAA that does not mention global warming in their seasonal forecasts, I don’t see it mentioned in any of the forecasts listed at this page, from around the world:
http://www.aoml.noaa.gov/hrd/tcfaq/F3.html
Given that NOAA is issuing their seasonal forecasts in exactly the same manner, using the exact same methodology, as in past years, I don’t think this is a big deal or, as you suggest, a deliberate omission.
Thanks.
June 13th, 2006 at 11:18 pm
Good enough, thanks Roger.
It will get more interesting if they turn out to be as wrong this year as they were last year and we have some near or new records.
June 14th, 2006 at 1:47 am
FWIW, the FX market is predicting 17-19 storms.
http://www.ideosphere.com/fx-bin/Claim?claim=AtTS06