Post-Kyoto Per Capita Emissions In the EU-15 and US
October 21st, 2008Posted by: Roger Pielke, Jr.
UPDATED AGAIN . . .
Over at Climate Progress, Joe Romm asserts that climate policies in the EU represent
a very impressive achievement that should serve as an inspiration to the world.
This is an odd conclusion coming from Joe, since he is often going on about the end of the planet if we don’t act yesterday.
Rather than looking dispassionately at the EU as a forward-think policy laboratory, Joe instead chooses to attack the US and make the issue partisan. A more productive approach would be to look to the admirable EU leadership as an opportunity to learn about the practical challenges of emissions reductions, even when there is strong political support.
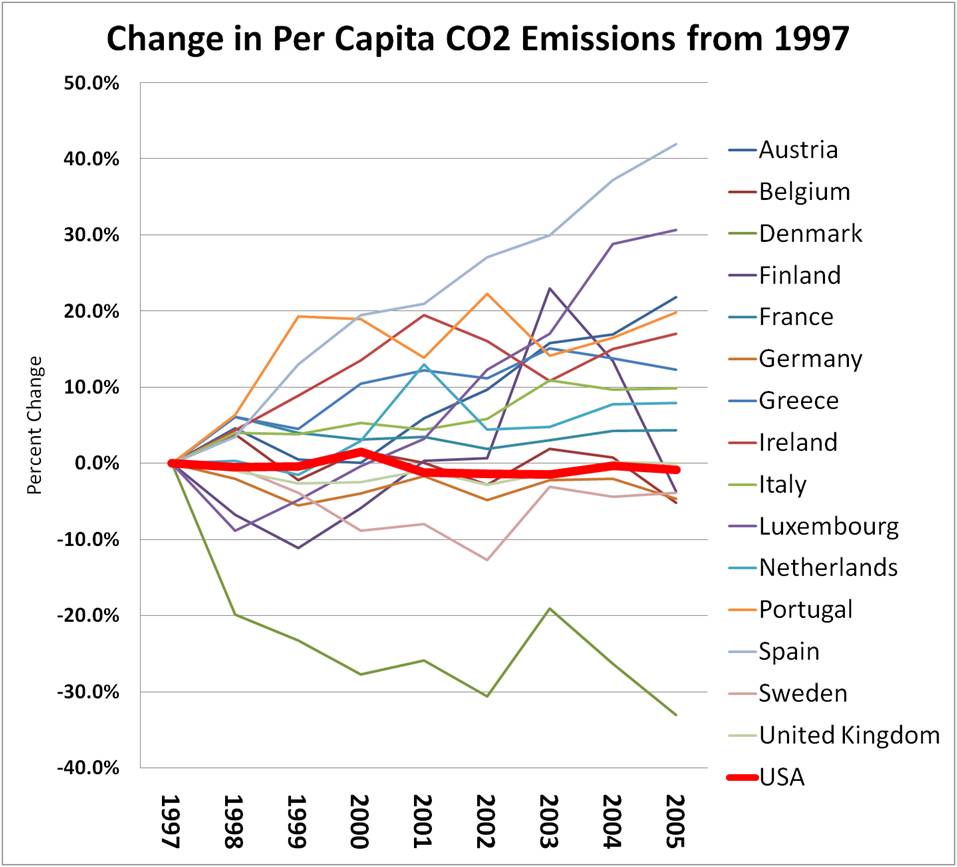
The following graph (using data from the US EIA here in .xls) needs little interpretation. It shows post-Kyoto per capita carbon dioxide emissions in each of the EU-15 countires as well as the US for 1997 to 2005 (the last year for which data was available, but I don’t think that extending to 2007 would make much difference). The overwhelming majority of countries of the EU-15 saw per capita emissions increase faster that the US. The lesson that one should take is not that the US is succeeding, but rather that the success of the EU has been overstated, and Joe propagates that myth.
Updates after the jump.
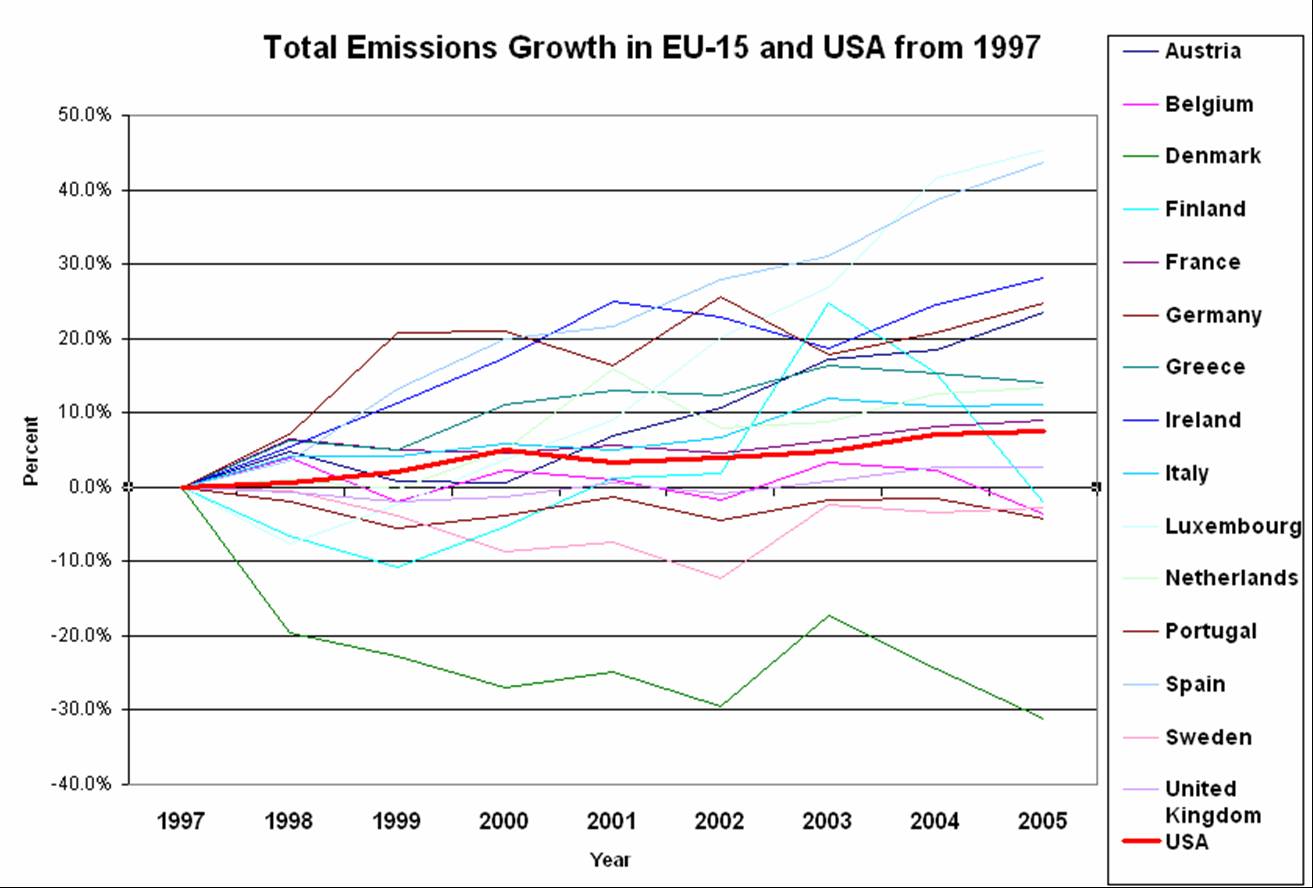
An update. Below is the data for total emissions using a 1997 baseline. Sorry for the poor quality. Quickly done using an old version of Excel.
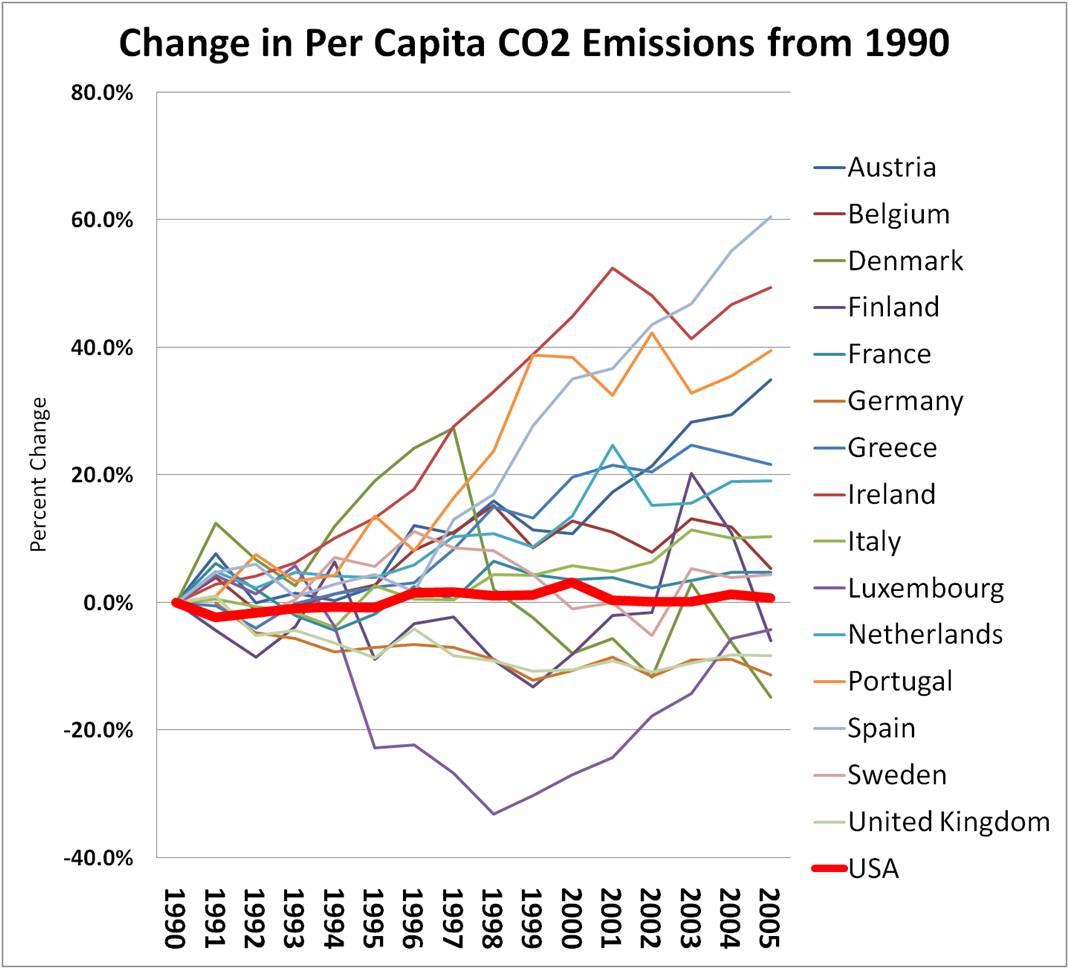
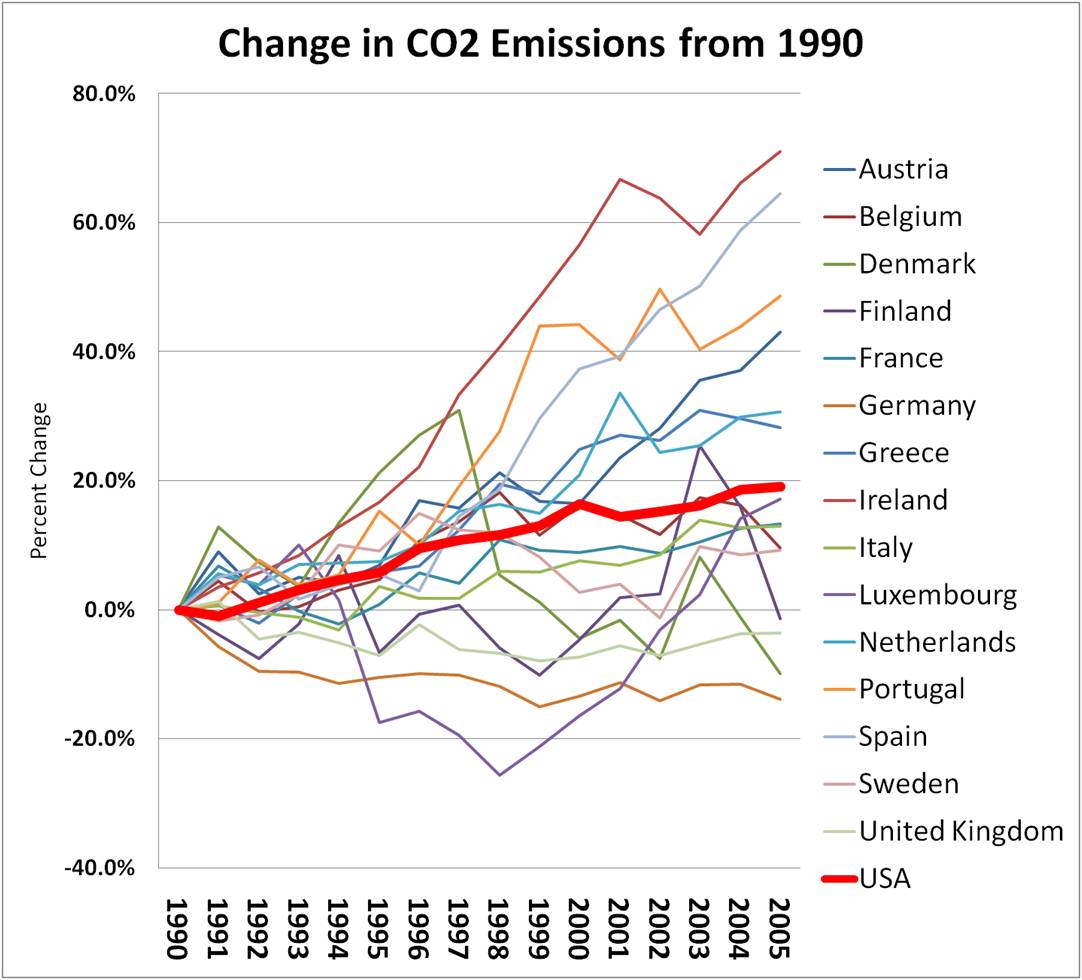
A second update. The two figures below show the same per capita and total emissions as above for the EU-15 and US, but starting in 1990. The US is in 9th place in the EU-15 plus US for total emissions, and 6th place for per capita emissions.
October 21st, 2008 at 9:06 am
According to this data from the EIA 6 of the EU 15 had per captia reductions greater than the US (UK, Germany, Sweden, Denmark, Finland, Belgium), and not by very much.
I am unsure what accounts for the very large reductions in Denmark.
October 21st, 2008 at 9:44 am
Roger,
This graph is not very helpful because the countries have different populations. If, e.g., Denmark’s population were 95% of the total EU-15 population, we could ignore all but Denmark and be very happy with the reduced emissions from the EU-15. Joe Romm’s graph of total emissions is more meaningful.
October 21st, 2008 at 9:50 am
lacoleman-
Joe wanted to factor out the effects of population growth. The best way to do that is to look at per capita emissions as I have done here.
Also, you are reading the graph incorrectly. Denmark shows the greatest per capita decline.
October 21st, 2008 at 10:03 am
“I am unsure what accounts for the very large reductions in Denmark.”
I don’t know either, but when I went looking for the answer, I found this webpage:
http://community.newvalues.net/2007/09/denmarks_co2_emissions_up_161.html
It says that Denmark’s emissions increased by an astounding 16.1 percent from 2005 to 2006, based on burning an even more astounding 50 percent more coal in 2006 than in 2005.
So the best-performing country on that graph would take a huge hit, if the spreadsheet went to 2006, instead of 2005.
October 21st, 2008 at 1:52 pm
It is remarkable to me that blogs like Climate Progress and Real Climate see fit to censor debate when they find themselves being challenged. Joe Romm has decided to not allow my responses to appear on his site, so I’ll post my final response to him here:
October 21st, 2008 at 2:45 pm
Roger,
Per capita does not obviously factor out population growth if that growth comes from immigration as it does in Europe. But if you want to present it that way, it should be for the EU-15 overall, not individual countries, because the latter is misleading. In any case the Kyoto agreement was about total output, not per capita.
No, I did not misread the graph. If Denmark were the dominant country population-wise, it would mean that the EU-15 did very well in reducing emissions (because Denmark did – see the graph) and we would “be very happy with the reduced emissions from the EU-15.”
October 21st, 2008 at 3:07 pm
lacoleman-
The per capita figures I am showing are total population, including immigration.
The report that Joe shared that started this conversation reported results country by country, so that is why I have also.
But if you want the totals, the are easily calculated from the EIA data:
1. US emissions increased by 19% 1990-2005
2. EU-15 emissions increased by 8% 1990-2005
(remember that Kyoto accounting does not include all emissions)
3. EU 15 minus UK and Germany saw emissions increase by 24% 1990-2005
4. UK and Germany saw their emissions decrease by 10% 1990-2005
So it is fair to conclude that the primary difference between the US and EU-15 over the period 1990-2005 was not Kyoto, or even climate policies, but German reunification and UK domestic energy policies.
This is even more apparent if we use 1997 as the base year (i.e., after the largest German and UK effects occurred). From 1997-2005 both the US and EU-15 saw total emissions increase by 7.0%.
October 21st, 2008 at 3:12 pm
At his blog Joe Romm has freed my post from its holding cell. Much appreciated.
October 22nd, 2008 at 11:39 am
The volatility of the Danish emissions is due to import from and export of electricity to Norway. Norway´s electricity production is almost 100 percent based on hydro. If the water reservoirs are reasonably full and hydro production can cover more than the needs of Norway, Norway exports electricity to Denmark, and the Danish coal-fired power stations then reduce their production and thus their emissions. The next year there may not be enough water ind the Norwegian water reservoirs for Norway´s own electricity consumption, and then the coal-fired Danish power stations eksport electricity to Norway and increase their emissions.
October 22nd, 2008 at 1:20 pm
FREDE-
Many thanks, and very interesting!
October 24th, 2008 at 5:17 pm
Dear Roger
In your reply blog of 21 October, 3.07 pm, you write that Kyoto accounting does not include all emissions. New Zealand is including methane emissions of ruminant animals in their emission trading scheme. I understand that not all countries are doing this. What is the Kyoto position?
I have always understood that the hypothesis that human greenhouse gas emissions cause global warming only considered emissions from fossil fuels (oil, gas, coal) and from fossil limestones (cement production). According to me, methane emissions from ruminants is part of a close loop. CO2 from the atmosphere is absorbed by grass, grass is eaten by ruminants. The carbon in the grass is used for the growth of the animals and part is emitted as methane by burping. This methane is changed to CO2 in 6 to 12 years and again absorbed by the grass. Part of the carbon is also sequestered by ruminants in their durable animal products, such as leather, wool and bone carvings. Therefore domestic ruminants, such as cattle and sheep are carbon sinks.
I would appreciate your (and others) comments.
Kind regards
Gerrit van der Lingen, Christchurch, New Zealand