Revisiting The 2006-2010 RMS Hurricane Damage Prediction
December 6th, 2007Posted by: Roger Pielke, Jr.
In the spring of 2006, a company called Risk Management Solutions (RMS) issued a five year forecast of hurricane activity (for 2006-2010) predicting U.S. insured losses to be 40% higher than average. RMS is an important company because their loss models are used by insurance companies to set rates charged to homeowners, by reinsurance companies to set rates they charge to insurers, by ratings agencies for evaluating risks, and others.
We are now two years into the RMS forecast period and can thus say something preliminary about their forecast based on actual hurricane damage from 2006 and 2007, which was minimal. In short, the forecast doesn’t look too good. For 2006 and 2007, the following figure shows average annual insured historical losses (for 2005 and earlier) in blue (based on Pielke et al. 2008, adjusted up by 4% from 2006 to 2007 to account for changing exposure), the RMS prediction of 40% more losses above the average in pink, and the actual losses in red.
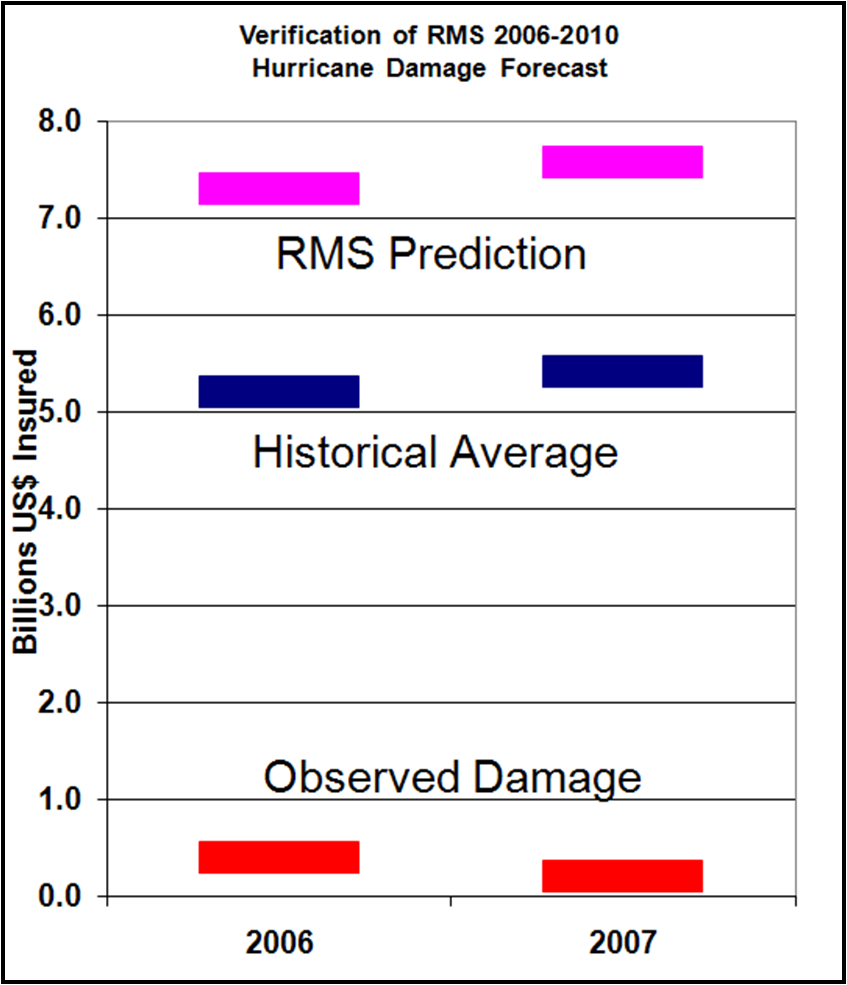
The RMS prediction obviously did not improve upon a naive forecast of average losses in either year.
What are the chances for the 5-year forecast yet to verify?
Average U.S. insured losses according to Pielke et al. (2008) are about $5.2 billion per year. Over 5 years this is $26 billion, and 40% higher than this is $36 billion. A $36 billion dollar insured loss is about $72 billion in total damage, and $26 billion insured is about $52 billion. For the RMS forecast to do better than the naive baseline of Pielke et al. (2008) total damage in 2008-2010 will have to be higher than $62 billion ($31 billion insured). That is, losses higher than $62B are closer to the RMS forecast than to the naive baseline.
The NHC official estimate for Katrina is $81 billion. So for the 2006-2010 RMS forecast to verify will require close to another Katrina-like event to occur in the next 3 years, or several large events. This is of course possible, but I doubt that there is a hurricane expert out there willing to put forward a combination of event probability and loss magnitude that will lead to an expected $62 billion total loss over the next 3 years. Consider that a 50% chance of $124 billion in losses results in an expected $62 billion. Is there any scientific basis to expect a 50% chance of $124 billion in losses? Or perhaps a 100% chance of $62 billion in total losses? Anyone wanting to make claims of this sort, please let us know!
From Pielke et al. (2008) the annual chances of a >$10B event (i.e., $5B insured) during 1900-2005 about 25%, and the annual chances of a >$50 billion ($25 billion insured) are just under 5%. There were 7 unique three-year periods with >$62B (>$31B insured) in total losses, or about a 7% chance. So RMS prediction of 40% higher than average losses for 2006-2010 has about a 7% chance of being more accurate than a naive baseline. It could happen, of course, but I wouldn’t bet on it without good odds!
So what has RMS done is the face of evidence that its first 5-year forecast was not so accurate? Well, they have declared success and issued another 5-year forecast of 40% higher losses for the period 2008-2012.
Risk Management Solutions (RMS) has confirmed its modeled hurricane activity rates for 2008 to 2012 following an elicitation with a group of the world’s leading hurricane researchers. . . . The current activity rates lead to estimates of average annual insured losses that will be 40% higher than those predicted by the long-term mean of hurricane activity for the Gulf Coast, Florida, and the Southeast, and 25-30% higher for the Mid-Atlantic and Northeast coastal regions.
For further reading:
Pielke, R. A., Jr., Gratz, J., Landsea, C. W., Collins, D., Saunders, M. A., and Musulin, R. (2008). “Normalized Hurricane Damages in the United States: 1900-2005.” Natural Hazards Review, in press, February. (PDF, prepublication version)