Visually Pleasing Temperature Adjustments
June 2nd, 2008Posted by: Roger Pielke, Jr.
This is a follow up to our continuing discussion of the possible implications of changes to mid-century global average temperatures for conclusions reached by the IPCC AR4, and how scientists react to such changes.
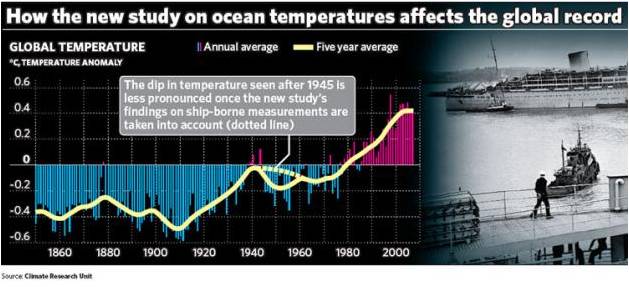
Over at Real Climate they pointed to the following figure as representing “a good first guess at what the change will look like” and asserted that it would have no meaningful implications for the trends in temperature rise since mid-century presented by the IPCC.
Since there was some disagreement here in the comments of an earlier post about how to interpret this graph, I have decided to simply replicate it and then see if I could exactly replicate the graph from the Independent. The data is available here.
The first thing to note is that the Independent graph has a major error which Real Climate did not point out. It says that the smooth curve represents a 5-year average, when in fact, it actually represents a 21-point binomial filter. The difference in smoothing is critically important for interpreting what the graph actually says, and the error confused me and at least one climate scientist writing in our comments.
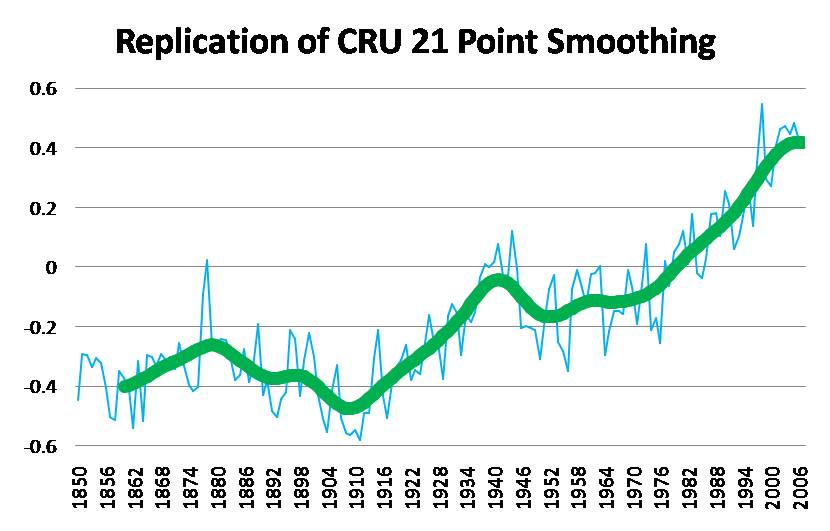
Here is a replication of the 21-point smoothing generated from the annual values, which will allow for my effort to replicate the graph from the Independent.
So far so good. But replication of the adjusted curve is a bit tricky as changing data for any one year has implications for the shape of the curve 10 years before that year and 10 years after. Upon trying to create a exact replication of the graph from The Independent, right away I realized that there was a major problem, because adding any increment to where Thompson et al. said it should begin (in 1945) instantly raised the adjusted curve to a point above the unadjusted curve. And as you can see in the Independent graph that at no point does the adjusted curve rise above the unadjusted curve, much less by a significant amount as implied by Thompson et al..
So right away it seems clear that we are not trying to make an adjustment that actually draws on the guidance from Thompson et al. This might seem odd, since the graph is supposed to show a proposed “guess” at the implications of Thompson et al. In any event, with that constraint removed I simply tried to get the best visual fit to the Independent graph that I could. And here is what I came up with.
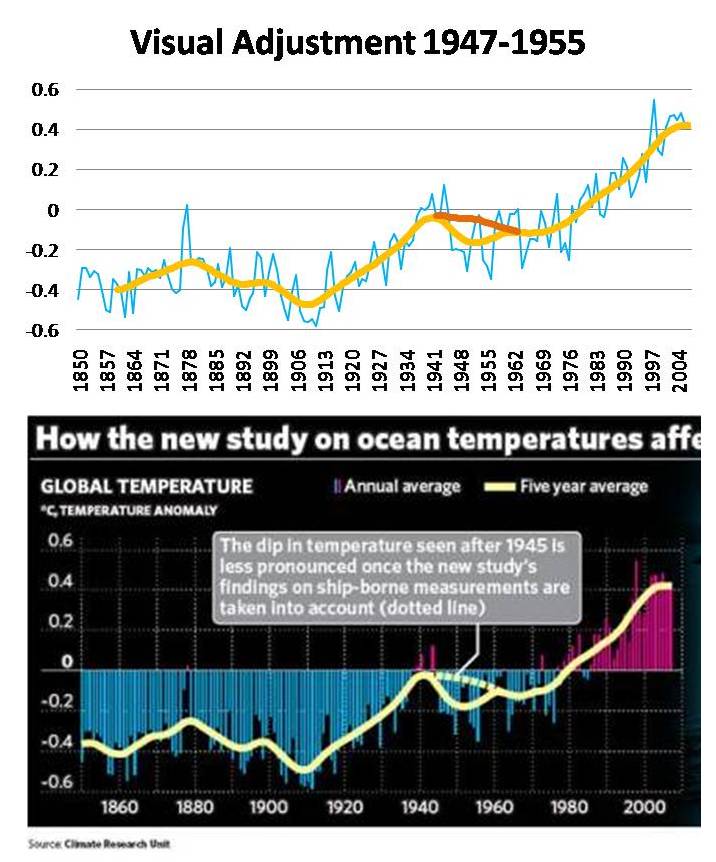
Now, given the complicated smoothing routine, there is certainly any number of combinations of weird adjustments that will result in a very similar looking curve. (And if anyone from CRU is reading and wants to share with us exactly what you used, and the basis for it, please do so.) The adjustments I used are as follows:
1945 0
1946 0
1947 0
1948 0.1
1949 0.25
1950 0.18
1951 0.18
1952 0.18
1953 0.18
1954 0.16
1955 0.16
1956 0
1957 0
1958 0
1959 0
1960 0
Oh yeah, the effect of these visually pleasing adjustments on the IPCC trend from 1950? Not that it actually means anything given the obvious incorrectness, but it would reduce the trend by about 15%.
June 2nd, 2008 at 11:27 am
I should think it would be the height of foolishness to NOT speculate on the possible effect of the temperature shift on the estimate for the trend since the 1950’s. Presumably, since forcing due to GHGs is increasing non-linearly, we sort of expect warming to be increasing non-linearly. The extent to which this is happening over long time scales ought to be of interest.
Why would speculation be foolish? What’s foolish is to act as both the following are true: a) The temperatures during the fifties are likely to be revised non-negligible, but unstated amount but b) in the meantime, pretend this won’t affect the calculated trend.
Hopefully, those working on creating the temperature records will publish their revised estimates for temperatures soon.
June 2nd, 2008 at 2:39 pm
James Annan has shown that by picking dates starting after the adjustment drops to zero, there is no difference in the trend. Or if you start well before, there is little difference. I guess this rebuts some strawman living in a corn field somewhere in Nebraska.
Then, in a masterful decision to actually engage your actual claim, he begins the trend by the period affected by the trend, he gets a 20% difference.
While one might not know based on the tone he confirms what you say: If you estimate a trend beginning from the region where the change is made, this affect the calculated trend.
I don’t understand why you pointing out the obvious is causing bloggers to foam at the mouth. I can’t help observing it though.
June 2nd, 2008 at 3:09 pm
Very interesting.
The IPCC chapter on observations has different periods for calculating the trends of surface temperatures. The 50 year trend in the IPCC is from 1956 to 2005, how is that affected by your corrections?
But is there a problem with drawing too many conclusions from putting a trend through a time-series that isn’t linearly changing? Looking at the IPCC’s chapter 9 it goes into great detail about the contributions from aerosols and greenhouse gases, (which is where the “very likely” statement comes from) how does your correction affect those conclusions? Is it possible that your corrections actually match the models better now?
June 2nd, 2008 at 4:10 pm
Alf-
If the adjustment period ends in 1960, then any calculation of trend from 1956 won’t be much affected.
The more important consequence of any adjustment (regardless of what it is) will be to reallocate some amount of 20th century warming.
Will this matter for the models? If you look at the IPCC comparison of model spread and observations in the SPM the temperature record shows a blip that sticks up, what one scientist (Susan Solomon, I think) called a sore thumb. But the adjustment will raise the curve, not lower it, so, I’m not sure what effect it will have. It is not obviously a better match.
More generally it will prompt a revisiting of the adjustments not just to SSTs but NMAT as well which are adjusted values, and used to compare with SSTs.
If observational uncertainties in fact increase, then I know a few modelers who will love that — more opportunity for “consistent with”
June 2nd, 2008 at 4:10 pm
Roger,
Don’t overlook the final sentence of Thompson et al.’s paper:
“However, compensation for a different potential source of bias in SST data in the past decade—the transition from ship- to buoy-derived SSTs—might increase the century-long trends by raising recent SSTs as much as ~0.1ºC, as buoy-derived SSTs are biased cool relative to ship measurements.”
I have little doubt that there will be a correction introduced in the recent years that will serve to (more than?) offset the influence in recent trends of the mid-century correction.
You can call me a monkey’s uncle is this does not turn out to be the case. And also if the corrections don’t lead to the stated conclusion that climate models are even performing better than we thought! (Hint: Gavin is already suggesting that the latter will be the case).
-Chip
June 3rd, 2008 at 3:21 am
Roger
O.k., now we are on similar ground. Your trend reduction estimate is now half of what it has been before (15% instead of 30%).
However, don’t forget that the Independent graph only was a “first guess”, probably visual, and not a calculation, because the correction calculation has not been done yet. If you haven’t got the values, you can’t calculate. Any visual “first guess” will be “wrong”, compared to a calculation, this is not a very illuminating statement.
Let’s assume, that there is a trend correction between 10 and 20% for the period 1950 to 2007. What does that mean? It mainly changes some noise on the decadal scale in one period . As has been pointed out, if you do that just at the beginning or the end of that period, you will change the trend. But does that change any important conclusion or understanding of mechanisms? Since climate sensitivity or the impact of CO2 or aerosols in climate models are not derived from measured trends, but from physics, and since the match between models and observations will not change significantly, and since the 1950-2007 trend does not constrain climate sensitivity, it’s hard to see, what worldshaking alterations in the understanding of the climate system will follow from that correction. Or do you have some ideas, based on solid ground?
BTW, it is very interesting, that climate scientists can do what they want, they are on the wrong side.
- If they do not alter or correct the data, they are called obstinate, sticking to their opinion. (E.g. McIntyre + Co.)
- If they correct the trend down, this is taken as proof that their data is wrong (if anything is wrong, all the rest will be wrong, too), and that one can forget global warming (e.g. Pielke + Co.)
- If they correct the trend up, this is taken as proof that they just manipulate their data to show what they want (E.g. Knappenberger + Co.).
What if they just do scientific work?
It is very easy to critizize and let the others do the work. Roger, you are very quick in asking the scientists to do the calculations. However, to do that thoroughly takes much time, and the time of scientists is limited as it is for any other people on Earth. Just critizize that not all the work has been done yet and placing some quick guessing or calculations on the internet, is unfair (to be polite).
To say that there might be a problem (McIntyre) is done much more quickly than to do the calculations thoroughly and write a scientific paper (Thompson et al.).
June 3rd, 2008 at 4:38 am
@Lucia
“Presumably, since forcing due to GHGs is increasing non-linearly, we sort of expect warming to be increasing non-linearly. ”
That is an utterly wrong argument and quite astonishuing for someone who is running a webside on climate sciences. The CO2 rise is exponential, the RF is logarithmically related to CO2. Non-Linearities come from many processes but not from the GHGs and their RF.
June 3rd, 2008 at 7:08 am
Georg
“Non-Linearities come from many processes but not from the GHGs and their RF.”
If you are referring to the non-linearities arising from the convective terms in the Navier-Stokes equations, yes, there are many non-linearities. But, these are mostly thought to result in the “weather noise”, which averages out over time.
However if you are suggesting that the forcing function is thought to be linear, then you must disagree with the forcings applied to Model E.
You can down load the forcings from NASA giss, and see the distinct non-linearity in the forcing applied since 1900. I’ve plotted the graph. If you click, it looks like this.
http://rankexploits.com/musings/wp-content/uploads/2008/02/globalwarming_forcings.jpg
If you drive any system that conserves energy, that forcing should result in a trend in the average temperature that rises non-linearly. Feel free to get out a ruler to see if the top blue line makes a straight line. It’s not. Check if the GHG forcings are a straight line.
You’ll see neither is: That is the non-linear forcing I metioned.
It may surprise you to learn that one of the reasons the models *actually do* predict less rapid warming during the early part of the century and more rapid warming during the later part is the result of this non-linear increase in forcing.
It is certainly not the only non-linearity. But I don’t think I implied any such thing. But, if you really think comparing trends in different time periods isn’t important to attribution, then please answer this:
Why do you think climate scientists make much of the observed rapid increase in the trend in the 90s?
June 3rd, 2008 at 8:21 am
Urs-
Can you point to where I said anything along the lines of the following that you attribute to me? (Hint: You can’t.)
“If they correct the trend down, this is taken as proof that their data is wrong (if anything is wrong, all the rest will be wrong, too), and that one can forget global warming (e.g. Pielke + Co.)”
Similarly, can you show where have I criticized “that not all the work has been done yet”? (Hint: You can’t.)
These are straw men arguments.
It turns out that one of the central conclusions of the IPCC (trends since 1950) expressed with a 90% confidence level, may be incorrect or problematic. Is this possible outcome, and how scientists respond to it, interesting? Yes. Does it change my views on climate policies? No, not at all.
Discussions of climate science are going to take place on blogs, in newspapers, in classrooms, in pubs, on the street and at dinner tables. Climate science will be critiqued by people who know nothing and people who know something. Get used to it. It is not going away.
June 3rd, 2008 at 8:53 am
Urs-
If you want to better understand why some people are deeply troubled by the public behavior of some climate scientists (fairly or unfairly), you need only look at your series of comments on this post.
1. You criticized the first example I showed (fair enough)
2. You then point to a newspaper article as having a better adjustment, and disagree with my first interpretation of it (fair enough)
3. I take you up on your suggestions and take the time to replicate the newspaper article’s graph
4. I find that the newspaper article is misleading and contains a serious error (one that clearly fooled you as well, and was not disclosed by Real Climate)
5. I take the time redo the analysis as you suggested and arrive at different results (of course, my first post expressed an openness to any proposed adjustment)
6. In response to my efforts you defend the newspaper article saying “Any visual “first guess” will be “wrong”" (Well if it was wrong, why did you, and others, suggest that it was a good guess)
7. You then change subjects and criticize me for even engaging this topic and make up some nonsense about my policy views on climate change. You ignore my responsiveness to your suggestions.
In this process, what many people will see is a scientist unwilling to admit error (in your interpretation of the the Independent article, much less the IPCC) and who will readily ascribe evil political motives to others when a debate doesn’t fall exactly their way.
It all-too-common to see exactly this public behavior among some climate scientists — strident claims of infallibility combined with political accusations of anyone disrespectful enough to challenge or critique them.
Remember that this discussion started with the publication of Thompson et al. finding a major error in temperature records (that went unnoticed through 4 (!) IPCC peer review assessments), it is not at all unreasonable that people will explore implications and ask questions.
Especially a scholar (me) who studies scientists and science in highly politicized contexts.
Such discussions are not going away. Scientists wanting to be left alone should study a topic particle physics, and not a subject at the center of global political debate;-)
June 3rd, 2008 at 10:14 am
Lucia
“If you are referring to the non-linearities arising from the convective terms in the Navier-Stokes equations, yes, there are many non-linearities. But, these are mostly thought to result in the “weather noise”, which averages out over time.”
No, I am referring to the really relevant feed back mechanisms. Many of them are non-linear (such as the sea ice albedo feed back (included in IPCC estimates) or methan mobilisation in perma frost (not included)).
” Feel free to get out a ruler to see if the top blue line makes a straight line. It’s not. Check if the GHG forcings are a straight line.”
For me the GHGs are sufficiently linear. The CO2 rise is exponential, its radiative impact is logarithmic. Of course there are a number of ups and downs (wars, economic crisis etc, also methane has a RF that goes with the sqrt and not logarithmic etc).
“Why do you think climate scientists make much of the observed rapid increase in the trend in the 90s? ”
Well not because of the GHG RF obviously. It’s because feedback processes really start being effective (such as seen in the 2007 Arctic sea ice loss).
June 3rd, 2008 at 10:32 am
>>Remember that this discussion started with the >>publication of Thompson et al. finding a major >>error in temperature records (that went unnoticed >>through 4 (!) IPCC peer review assessments),
Out of curiosity, I clicked the link to the IPCC discussion of the complications involved, we find what we have always known: The complications are discussed, but the text in no way suggests the series of adjustments might be off by as much as 0.3C during any period of time.
So what we find in the supplemental material for the IPCC AR4 is a document that discusses the many issues involved in determining (or estimating ) the SST, but overall conveys the impression the current estimate in the AR4 are more or less good. Or more specifically, there is nothing to suggest the SST data could be off by as much as 0.3C. (There is, in fact, no quantitative statement made about possible errors during WWII.)
If errors as large as 0.3C in the SST record were suspected, they were not disclosed in the AR4. The alternative is they were not suspected to exist — or at least errors of this sort were not considered likely by the authors of the AR4.
June 3rd, 2008 at 11:25 am
Roger
I never said that the newspaper graph had a better adjustment, I only said that your interpretation was questionnable (suggesting about a factor of two), and your reanalysis has confirmed this.
I agree that the notion of the 5y average in the newspaper is wrong. And everyone knows that there will be some difference before 1945 in a smoothed graph. The graph is not perfect, and I don’t defend the newspaper, because it is irrelevant and we are not talking about that. I, and Gavin too, were talking of a “first guess” and didn’t say anything else than that a correction might look similar to what was presented in the graph, irrespective of a mistake in the caption and mathematical inaccuracies. A first guess is not intended to represent all mathematical details, especially not in a newspaper graph. If you are happy to prove that there has been a mistake in a newspaper graph, feel free. I am not interested in that.
Why do you think that the trend since 1950 is a “central conclusion” of the IPCC? Where exactly does the IPCC say something about a 90% probability of a trend since 1950, and of what trend exactly?
The IPCC SPM says: “The linear warming trend over the last 50 years (0.13°C [0.10°C to 0.16°C] per decade) is almost twice that for the last 100 years.” They speak about the trend 1956-2006. Do you really think that after the correction this trend will be outside the given uncertainty range?
That’s what I meant, BTW: after a correction at one particular point of one particular data set, you are very quick to suppose that “one of the central conclusions of the IPCC might be incorrect”. There is a long way from a correction of the 50y trend, which is most probably way in the given uncertainty range, to an incorrectness of central IPCC conclusions, which are based on much more than a simple trend.
I never said, nor did RC, that there would be no implications for the trends, and that the last word has been spoken on the global temperaure record. There will be a lot more corrections and improvements in the future. But before questionning “central IPCC conclusions” the relevance of the corrections for these conclusions has to be taken into account.
You blame e.g. the IPCC for not having done these corrections for a long time. That’s what I meant with “that not all the work has been done yet“.
June 3rd, 2008 at 11:37 am
Urs-
The first graph I posted (from Steve McItyre) was also a “first guess” and so everything that you say about the Independent “first guess” applies there as well.
I am unclear why you wish to present McIntyre’s first guess as being “mine” and The Independent’s as being yours and Gavin’s. They are both just guesses. I don’t know which one will look more like whatever future adjustments are made. That is why I discussed them both. In either case they are significant (as in large), with likely implications for a number of studies (e.g., for instance huricanes vs. ssts).
The relevant IPCC statement from the SPM:
“Most of the observed increase in global average temperatures since the mid-20th century is very likely due to the observed increase in anthropogenic greenhouse gas concentrations.”
I discussed why a reduction of 20/30/50% might be problematic for this statement in my first post, so no need to discuss here. When the IPCC says something with 90% confidence, it would not be a surprise to later learn that 10% of those statements were in error, would it?
Where did I blame the IPCC for anything? Here you raise another strawman.
June 4th, 2008 at 3:49 am
Roger
The 90% confidence relates to the assertion that “most of the trend is related to GHG’s”, not to the amount of the trend, and it does not mean that the anthropogenic part is at least 90%. O.k.?
Even if the trend would be reduced by 50% (which will not be the case, as you could see in your calculation, it’s likely less than 20%), this assertion is still true, because the influence of other known factors on the trend is very low (volcanoes negative, sun likely less than 15%). The GHG influence would still be more than 70%, which corresponds to “most”.
June 4th, 2008 at 7:53 am
Urs-
Another strawman I see. Where did I ever say that “the anthropogenic part is at least 90%”? (Hint: I did not.)
I remain puzzled by your repeated mischaracterizations of my statements, followed by a failure to correct them when pointed out.
We’ll have to see if increasing the GHG influence to 70% (or more) of the mid-century trend will not cause some questions for existing attribution studies. Maybe, maybe not, but it is a bit concerning when a scientist tell me the answer before the work is done.
June 4th, 2008 at 10:24 am
“The 90% confidence relates to the assertion that ‘most of the trend is related to GHG’s’…”
“Even if the trend would be reduced by 50% (which will not be the case, as you could see in your calculation, it’s likely less than 20%), this assertion is still true,…”
No, it’s not “still true,” EXCEPT if it is made clear that the TREND has been lowered by 50% (assuming 50% error…which I agree is unlikely).
If the error is 50% or more, the original statement (which was made about the ORIGINAL, pre-correction trend) is false. If the error is 50% or more, then the majority of the observed trend was measurement error.
June 5th, 2008 at 4:23 am
Roger
you misunderstood.
The IPCC says with 90% confindence:
“Most of the observed increase in global average temperatures since the mid-20th century is very likely due to the observed increase in anthropogenic greenhouse gas concentrations.”
You wrote:
“When the IPCC says something with 90% confidence, it would not be a surprise to later learn that 10% of those statements were in error, would it?”
So can you please explain what it means that the above statement is “10% in error”? How can the statement, that GHGs are the main reason, be “10% in error”? How do you calculate that?
June 5th, 2008 at 10:27 am
Urs-
I simply mean that if the IPCC provides (for example) 100 different assertions in its report, each one expressed at 90% confidence, then we should expect that 10 of those statements will ultimately be in error …
If the IPCC has accurately calibrated its uncertainties.
And if the statements are independent.
Similarly, half of all statements expressed at 50% confidence will be wrong.
June 6th, 2008 at 1:28 am
Roger
o.k., now I understand.
That is the same thing as to say, that from 60 throws of a dice we expect that 10 of them will be a “6″. Are you sure? It might also be 7 or 15 “6″. Or even zero.
From 100 statements, it might be 3,11,20 or whatever (each with a certain probability) that will turn out to be wrong. That’s the theory of probabilities. We just don’t know. And we have no idea, which of these statements it might be.
So, what has this to do with the discussion about correction of the global temperature record? The IPCC says, that with 90% confidence (or probability) the trend over the last 50 years (i.e. 1956-2005) is in the range of 0.10 – 0.16K per decade (numbers in sqare brackets represent the 90% confidence interval in the SPM). Do you really expect that after the correction the 1956-2005 trend will be out of that range? I am pretty sure that not.