Weighing in on Emissions Reductions in the EU
June 1st, 2009Posted by: Roger Pielke, Jr.
The European Environment Agency released a new report last week detailing greenhouse gas emissions in the European Union. Joe Romm lauds the performance of the EU and says that
I fully expect our old friend Roger Pielke, Jr. to weigh in . . .
Not wanting to disappoint Joe, here are some facts that might supplement Joe’s comments on the EU and emissions reductions.
1. The EU has reduced its emissions over the past few years. Why? The EEA explains the recent reductions as follows:
Falling emissions since 2005 have largely resulted from the lower use of fossil fuels (particularly oil and gas) in households and services — these sectors, not covered by the EU Emission Trading System (ETS), are among the largest sources of GHG emissions in the EU. Warmer weather and higher fuel prices were the primary causes for the drop in emissions in 2006–2007, with most of the decrease occurring in households — particularly in Germany.
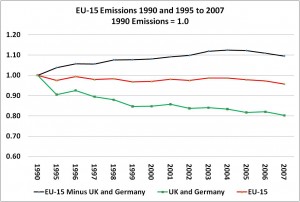
2. The report’s press release explains that “The EU-15 now stands 5% below its Kyoto Protocol base year levels.” You have to dig a little deeper to learn that that the EU-15 minus the UK and Germany saw its emissions rise by about 10% over its 1990 levels. What happened in the UK and Germany? The report explains (p. 17):
The overall EC GHG emission trend is dominated by the two largest emitters, Germany and the United Kingdom, which account for about a third of total EU-27 GHG emissions. These two Member States have achieved total GHG emission reductions of 393 million tonnes CO2 equivalents compared to 1990.(6)
The main reasons for the favourable trend in Germany were increasing efficiency in power and heating plants and the economic restructuring of the five new Länder after the German reunification. Reduced GHG emissions in the United Kingdom were primarily the result of liberalising energy markets and the subsequent fuel switches from oil and coal to gas in electricity production and N2O emission reduction measures in adipic acid production.
You can see the relative performance in the following graph, from data in Table ES.8.

3. Evaluating specific European climate policies, especially the performance of the ETS is pretty much impossible with the data in the EEA report. The ETS covers only a subset of economic activity that results in emissions. However, the report itself makes no claims about the effectiveness of the ETS, which itself is notable. Further the Kyoto process excludes certain emissions, like those from aviation and shipping.
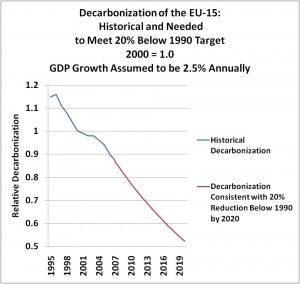
As I have argued here before, it is not simply emissions that matter, but decarbonization of the economy, as policy makers have a desire to grow the economy while at the same time decreasing emissions.
The following graph shows what rate of decarbonization would be necessary to achieve a 20% reduction in EU-15 emissions below 1990 levels, assuming 2.5% annual economic growth for the period 2007-2020 (which is illustrative in this case, other numbers will of course lead to other results), as well as actual EU-15 decarbonization, with emissions data from the EEA report and GDP data from the EU. It shows a very large task ahead for the EU-15, which has the advantage of a low population growth and sustained rates of historical decarbonization in the absence of climate policies. Whether such rates will continue is an open question.

Decarbonization of the economy is a more meaningful basis on which to evaluate climate policies, and not simply emissions.