Temperature Trends 1990-2007: Hansen, IPCC, Obs
January 18th, 2008Posted by: Roger Pielke, Jr.
The figure below shows linear trends in temperature for Jim Hansen’s three 1988 scenarios (in shades of blue), for the IPCC predictions issued in 1990, 1995, 2001, 2007 (in shades of green), and for four sets of observations (in shades of brown). I choose the period 1990-2007 because this is the period of overlap for all of the predictions (except IPCC 2007, which starts in 2000).
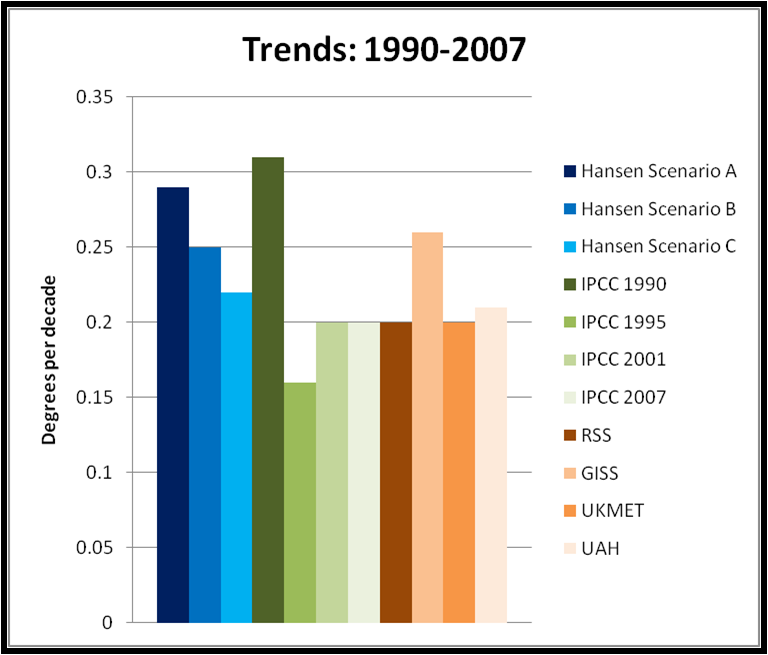
Looking just at these measures of central tendency (i.e., no formal consideration of uncertainties) it seems clear that:
1. Trends in all of Hansen’s scenarios are above IPCC 1995, 2001, and 2007, as well as three of the four surface observations.
2. The outlier on surface observations, and the one consistent with Hansen’s Scenarios A and B is the NASA dataset overseen by Jim Hansen. Whatever the explanation for this, good scientific practice would have forecasting and data collection used to verify those forecasts conducted by completely separate groups.
3. Hansen’s Scenario A is very similar to IPCC 1990, which makes sense given their closeness in time, and assumptions of forcings at the time (i.e., thoughts on business-as-usual did not change much over that time).
The data for the Hansen scenarios was obtained at Climate Audit from the ongoing discussion there, and the IPCC and observational data is as described on this site over the past week or so in the forecast verification exercise that I have conducted. This is an ongoing exercise, as part of a conversation across the web, so if you have questions or comments, please share them, either here, or if our comment interface is driving you nuts (as it is with me), then comment over at Climate Audit where I’ll participate in the discussions.
January 18th, 2008 at 8:49 am
testing…..
January 18th, 2008 at 8:58 am
Is that GISS Met Station Data? Or Land Ocean?
I’ve pretty much convinced myself that the principle of comparing like to like requires us to compare computations to Land-Ocean data whenever possible. The reason I think this is:
1)the GCMs compute surface temperatures including areas over both the land and the ocean.
2) We understand why surface temperatures are likely to vary more quickly than ocean values based on phenomenology.
So, in periods of warming, measurements over land will rise faster (and this is even without considering any heat island effects.)
Of course, as a practical matter, if we distrust the measurements over the oceans, I’d go with the land based only measurements.
January 18th, 2008 at 9:45 am
Lucia- Thanks (and congrats for getting a comment through;-) I showed Met Stations, Land/Ocean trend is 0.22.
January 20th, 2008 at 11:56 am
Hi Roger,
Just for clarity, can you repeat what the scenarios are for the IPCC values for 1990, 1995, 2001, and 2007?
The scenario for 2001 and 2007 is A1F1, right?
January 20th, 2008 at 2:51 pm
Mark- Correct.
January 21st, 2008 at 11:32 am
A comment sent in by email from Roger Cohen:
“I think your focus on identifying metrics to track “projections” by the
IPCC and others involved in the climate change business is a very
worthwhile effort. Every significant business enterprise does this in
one way or another. And since there is so much at stake here, it seems
reasonable to insist on some kind of quantitative accountability for the
computer-based projections from which policy recommendations have
emerged. However, I suspect that unless the effort generates a
sustained focus such as suggested below, it is not likely to overcome
resistance to the concept.
I believe the number one metric remains global average temperature
change, flawed and incomplete that may be. As you point out, even that
simple metric is subject to issues around the choice of a data set. For
example, it is possible to do some statistics on the differences between
the various data sets over a particular interval. If one compares the
GISS data set for 2001-2007 with the UKMET (HadCRUT3) data set, one
finds that the difference between the regression slopes over this period
is 1.16 standard deviations, implying that there is a 97% chance that
the UKMET set is giving a systematically lower trend than GISS over the
past seven years. A similar analysis using the NCDC data set gives an
86% chance that it is giving a lower systematic trend than GISS. This
finding, combined with the problems revealed last year in the treatment
of U.S. data and the less-than-arm’s-length relationship between Jim
Hansen and data set preparation, reduces confidence in using the GISS
data set in future metric analyses. And as you point out, the
satellite-based observations are different yet. Naturally over the
longer term, these differences will likely become unimportant, but we
are talking here about assessing the reliability of IPCC projections
over intermediate time frames.
To establish a basis for agreement on how to deal with global average
temperature and other metrics, it may be worthwhile to convene a
workshop of parties from various disciplines who have a serious and
sincere interest in arriving at an empirical way of assessing the
technical merit of IPCC projections. A successful outcome of such a
workshop and any follow up activities would be an agreement on key
measurements and data analyses which would be followed for an indefinite
period of time. An annual report of the state of the analyses could be
published in a widely-read climate research journal or in an independent
vehicle. Though universal support is not realistic, such a step could
garner support from advocates and skeptics alike and head off much
future cherry-picking by one side or another. Because the IPCC’s
impartiality has been questioned in some quarters, the process of
monitoring its own projections should not be left entirely to that
organization. I believe that your (and that of Professor Pielke senior)
role in keeping the system honest, while not denying human impact on
climate, positions you to take the lead in such a project.
Roger W. Cohen
Durango, CO”
January 25th, 2008 at 10:02 am
*If* global temperature would be a good way to track “global warming” the only accurate way to do it would be without any subjective corrections for, e.g., UHI.
That means MSU. Period.
January 28th, 2008 at 4:17 pm
Hansen, the IPCC and observational temperature data are being compared and analyzed here through a well read bar chart showing a linear trend in global temperature. Even a layman can gather some idea from this chart.
http://www.beautyfinder.co.uk/beauty–mobile-therapists-7-151-subcategory.html