Does the IPCC’s Main Conclusion Need to be Revisited?
May 29th, 2008Posted by: Roger Pielke, Jr.
Yesterday Nature published a paper by Thompson et al. which argues that a change in the observational techniques for taking the temperatures of the oceans led to a cold bias in temperatures beginning in the 1940s. The need for the adjustment raises an interesting, and certainly sensitive, question related to the sociology and politics of science: Does the IPCC’s main conclusion need to be revisited?
The Nature paper states of the effects of the bias on temperature measurements:
The adjustments immediately after 1945 are expected to be as large as those made to the pre-war data (.0.3 C; Fig. 4), and smaller adjustments are likely to be required in SSTs through at least the mid-1960s.
Thompson et al. do not provide a time series estimate on the effects of the bias on the global temperature record, but Steve McIntyre, who is building an impressive track record of analyses outside the peer-review system, discussed this topic on his weblog long before the paper appeared in Nature, and has proposed an adjustment to the temperature record (based on discussions with participants on his blog). Steve’s adjustment is based on assuming:
that 75% of all measurements from 1942-1945 were done by engine inlets, falling back to business as usual 10% in 1946 where it remained until 1970 when we have a measurement point – 90% of measurements in 1970 were still being made by buckets as indicated by the information in Kent et al 2007- and that the 90% phased down to 0 in 2000 linearly.
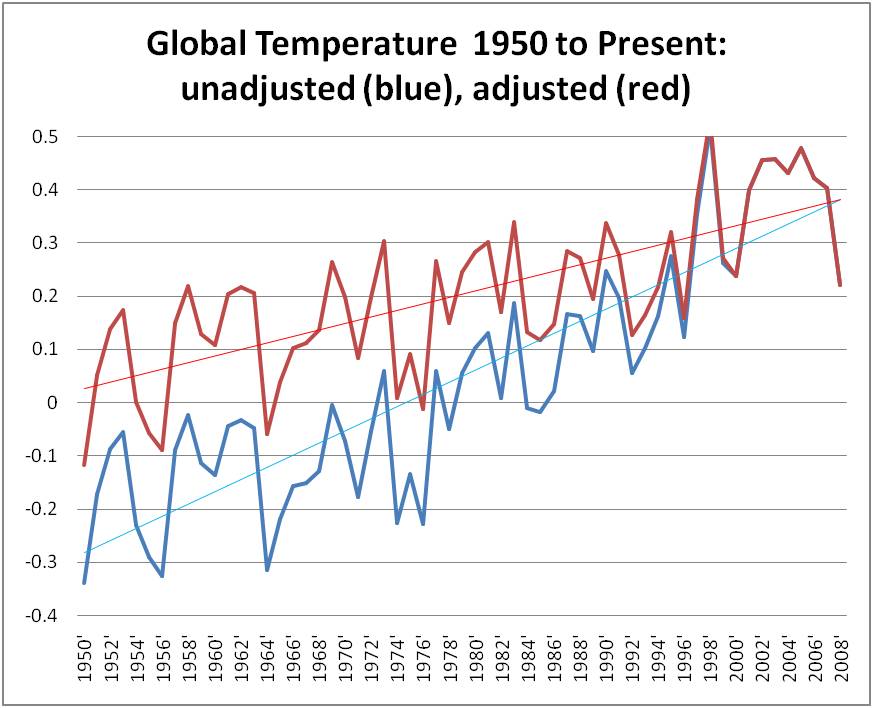
The effects of McIntyre’s proposed adjustments (on the UKMET global temperature record) are shown in the following figure.
Other adjustments are certainly plausible, and will certainly be proposed and debated in the literature and on blogs (McIntyre discusses possible implications of the adjustments in this post.). But given how much research has been based on the existing global temperature record, it seems likely that many studies will be revisited in light of the Nature paper. In a comment in Nature that accompanies Thompson et al., Forest and Reynolds suggest:
The SST adjustment around 1945 is likely to have far-reaching implications for modelling in this period.
In the figure above, the trend in the unadjusted data (1950-present) is 0.11 Deg C per decade (slightly lower than reported by IPCC AR4, due to the recent downturn), and after the adjustments are applied the trend drops by just about half, to 0.06 Deg C per decade.
And this brings us to the IPCC. In 2007 the IPCC (PDF) concluded that:
Most of the observed increase in global average temperatures since the mid-20th century is very likely due to the observed increase in anthropogenic greenhouse gas concentrations
I interpret “mid-20th century” to be 1950, and “most” to be >50%. This means that the 2007 IPCC attributed more than 0.06 Deg per decade of the temperature increase since 1950 to increasing greenhouse gases. But we know now that the trend since 1950 included a spurious factor due to observational discontinuities, which reduces the entire trend to 0.06. So logically, if the proposed adjustment is in the ballpark, it would mean that one of the following statements must be true in order for the IPCC statement to still hold:
A. The entire trend of 0.06 per decade since 1950 should now be attributed to greenhouse gases (the balance of 0.06 per decade)
B. Only >0.03 per decade can be attributed to greenhouse gases (the “most” from the original statement)
C. The proposed adjustment is wildly off (I’d welcome other suggestions for an adjustment)
D. The IPCC statement needs to be fundamentally recast
So which is it?
PS. To ensure that this blog post is not misinterpreted, note that none of the mitigation or adaptation policies that I have advocated are called into question based on the answer that one gives to the question posed in the title.
May 29th, 2008 at 9:06 am
We’re putting in flooring, so I haven’t read the paper in any detail. It will be interesting to see what various people suggest for the new temperatures during the 40-60s era. Right now, it appears the mid-forties data quality has been officially put in question, not just by Climate Audit, but by a paper published in Nature.
This new finding will be spun all kinds of ways. Certainly, losing the empirical observations of low temperatures during the forties will tend to do just what you’ve shown in your figure: Reduce the empirical estimates of warming since the 50s.
It also likely will reduce the apparent amount of “weather noise”, which would make the remaining upward trend stand out with greater certainty. If so, we may conclude that a) warming isn’t quite so rapid overall but b) we have even greater certainty the uptrend is not due to “weather noise”.
Still, we won’t really know which conclusions people will make until we know what data adjustment are supported by the evidence about transitions between buckets/ inlets and bouys!
May 29th, 2008 at 9:49 am
If you look at CA’s proposed change to the full temperature record (last figure here http://www.climateaudit.org/?p=3114 ), it’s clear that the prewar-to-present trend is unaffected by the change. That improves the continuity of the long-run trend around WWII and should improve model-data fits (though it may also alter estimated forcings from aerosols). Since detection & attribution relies on the full record of absolute temperature anomalies, not trends of subsets, I’d speculate that there will be relatively little effect on the big picture, particularly as seen by GCMs, which aren’t directly fit to the temperature record anyway.
The IPCC statement is a little puzzling. Since the balance of non-GHG trends is thought to be negative, even prior to the correction one would have expected the GHG-only trend to exceed the observed trend.
May 29th, 2008 at 10:52 am
Somehow this opens a can of worms, if only it was the only problems.
From my understanding which is in no way the one of an expert the easiest way to go is to first return to the unadjusted data from pre-1941, since they were adjusted to compensate for the water intake.
Then adjust the period 1941-1945 by subtracting 0.3 C so water intake so it would conform to the bucket data.
Finally adjust 1945 to present by subtracting 0.3C from the data coming from water intake if possible.
The IPCC statement will need to be revisited.
The model will need to be re-tuned.
The aerosol effect will need to be revisited also.
May 29th, 2008 at 12:08 pm
Tom,
I’m not so sure this is true:
>>Since detection & attribution relies on the full >>record of absolute temperature anomalies, not >>trends of subsets,. . .
Part of attribution requires the rate of temperature increase to start increasing as the rate of CO2 increases. That is, if we look at the second derivative of GHG forcings, that should result in causing the second derivative of temperature to increase. Or in plainer language: Under the theory of AGW, many expect the rate of increase in temperature during the second half of the century should be faster than during the first half.
Or, in terms of what you said: When seeking attribution of the upward trend, I think we do compare trends in subsets of data.
The ambiguity associated with the bucket adjustments is quite problematic because it falls very near the center of the record. If the temperatures during the 40s and 50s move around enough, we may have a very difficult time with attribution.
Even if we don’t have trouble with attribution, the estimate of the magnitude of the effect of GHG’s is likely changed– because we never get any long sustained run up with *large* trends (except after volcanic eruptions!)
Worse, no matter where one moves the temperatures, the mere fact that people believe they need to be moved about, and different people have different theories about the magnitude of the required shift will mean any and all attributions depend on some ones *theory* about the precise bias in the data.
SteveM already posted his guess-ti-mate of the effect. Is it right? We don’t know. Others will now post their guesstimate of the effect. Will they be right? We don’t know. I’m not sure we even have sufficient information to know.
What’s even worse is that, to the extent that the correction of the data depends on any particular theory about warming, the data ceases to be useful for testing any theory about the causes or magnitude of warming.
This particular problem with the historic data is pretty thorny.
May 29th, 2008 at 1:36 pm
To All:
Is the entire discussion a bit off the mark?
The argument in Nature, and by Steve McIntyre, relates to ‘instrumental biases’ in sea surface temperature measurements. Associated with those measurements are SEPARATE surface air temperature measurements. The latter ARE NOT IN DISPUTE.
Although the apparent skill of those GCMs, using dynamic atmosphere/ocean flux modules, should be affected, the trends of OBSERVED surface air temperatures should not.
What am I missing?
Len Ornstein
May 29th, 2008 at 2:01 pm
Len- The abstract of Thompson et al. may help to explain:
Nature 453, 646-649 (29 May 2008) | doi:10.1038/nature06982; Received 28 January 2008; Accepted 4 April 2008
A large discontinuity in the mid-twentieth century in observed global-mean surface temperature
David W. J. Thompson1, John J. Kennedy2, John M. Wallace3 & Phil D. Jones4
1. Department of Atmospheric Science, Colorado State University, Fort Collins, Colorado 80523, USA
2. Met Office Hadley Centre, Exeter EX1 3PB, UK
3. Department of Atmospheric Sciences, University of Washington, Seattle, Washington 98195, USA
4. Climatic Research Unit, School of Environmental Sciences, University of East Anglia, Norwich NR4 7TJ, UK
Correspondence to: David W. J. Thompson1 Correspondence and requests for materials should be addressed to D.W.J.T. (Email: davet@atmos.colostate.edu).
Top of page
Abstract
Data sets used to monitor the Earth’s climate indicate that the surface of the Earth warmed from approx1910 to 1940, cooled slightly from approx1940 to 1970, and then warmed markedly from approx1970 onward1. The weak cooling apparent in the middle part of the century has been interpreted in the context of a variety of physical factors, such as atmosphere–ocean interactions and anthropogenic emissions of sulphate aerosols2. Here we call attention to a previously overlooked discontinuity in the record at 1945, which is a prominent feature of the cooling trend in the mid-twentieth century. The discontinuity is evident in published versions of the global-mean temperature time series1, but stands out more clearly after the data are filtered for the effects of internal climate variability. We argue that the abrupt temperature drop of approx0.3 °C in 1945 is the apparent result of uncorrected instrumental biases in the sea surface temperature record. Corrections for the discontinuity are expected to alter the character of mid-twentieth century temperature variability but not estimates of the century-long trend in global-mean temperatures.
May 29th, 2008 at 2:56 pm
Len Ornstein says:
“Associated with those measurements are SEPARATE surface air temperature measurements. The latter ARE NOT IN DISPUTE.”
Actually the surface measurements are very much in dispute. Micheals and McKitrick published a recent statistical analysis that suggests urbanization has contaminated the post-50s record and up to half of the reported warming may be spurious.
The counter argument has always been that land only accounts for 30% of the surface so contamination of the land record does not have a huge effect on the GMST. However, this argument is a double edged sword because it means errors in the SST record will have large effect on GMST.
May 29th, 2008 at 3:22 pm
Len- RP Sr. writes in with the additional response to you comment:
————–
See the 2007 CCSP report:
[http://www.climatescience.gov/Library/sap/sap1-1/finalreport/default.htm]
on this subject; e.g. Chapter 3 Sections 2.2 and 2.3 at
http://www.climatescience.gov/Library/sap/sap1-1/finalreport/sap1-1-final-chap3.pdf
and also Section 1.1 in
http://www.climatescience.gov/Library/sap/sap1-1/finalreport/sap1-1-final-chap2.pdf.
“Near-surface” air temperatures over the ocean (“Marine Air Temperatures” or MATs) are measured by ships and buoys at various heights from 2 to more than 25 meters, with poorer temporal and spatial coverage than over land (e.g., Rayner et al., 2003). To avoid the contamination of daytime solar heating of the ships’ surfaces that may affect the MAT, it is generally preferred to limit these to night MAT (NMAT)readings only. Observations of the water temperature near the ocean surface or “Sea Surface Temperatures” (SSTs) are widely used and are closely tied to MATs; ships and buoys measure SSTs within a few meters of the surface.”
The near surface air temperature and the SST are used essentially interchangeably in constructing the ocean contribution to the global average. See the rest of the discussions on this temperature interpretation there.
—————
May 29th, 2008 at 3:50 pm
Lucia -
I probably overstated my case a bit. My point was that there’s a lot of data available for D&A that is either long term (say 1880-present) or spatial, and thus is fairly immune to a blip in the middle. Looking at the GISS Model E 20th century ensembles, for example, it looks like they steam right past the WWII blip in global temperatures. The correction could easily improve the fit without any change to the model. I’d guess that the result would be similar with your Lumpy. However, until we actually have new data, that remains a guess.
“That is, if we look at the second derivative of GHG forcings, that should result in causing the second derivative of temperature to increase.”
Not quite. Temperature (or heat) integrates radiative forcing and transport processes, so you’d expect the second derivative of temperature to be related to the first derivative of forcing. In practice it’s hard to see the derivatives through the noise and uncertainty about initial conditions, so it’s sensible to focus on temperatures not trends. Hence my preference for large cumulative changes over long records.
What would be susceptible is an analysis like Schwartz (2007), because it relies on surface temperature and ocean heat entirely in the postwar era. In that case it’s hard to say what the net outcome will be, because ocean heat revisions for the XBT fall rate problem are apparently also forthcoming.
May 29th, 2008 at 7:34 pm
Roger and Roger Sr:
Thanks for the clarifications.
I had naively assumed that the near-surface marine air temps would be independent and relatively reliable.
Len Ornstein
May 29th, 2008 at 8:07 pm
Len,
adjusticating the post 40s dip could very well
improve the hindcast of ModelE. As it is ModelE hits the 30 year trend from 1940-1970 pretty well.
I’m more interested in what will happen to the frequency of “non volcanic cold spells”
May 30th, 2008 at 8:39 am
Steve–
If we simply decree that data become suspicious at 1945, nearly all non-stratospheric volcanic cold spells disappear. “poof”. (We always expect a 5% false- falsification rate with the 95% confidence interval, and the false-falsifiction rate drops to something like 7%. This includes falsifications on the high side.)
If the “suspicious” period starts earlier– say as early as 1941, when the British distracted by things like the London Blitz, even up-side false-falsifications using Cochrane-Orcutt may have disappeared. (This is primarily due to the effect on the 30 year trend used to ‘test’ the 7 year trends. The bucket-engine transition cooling makes it drop too!)
That said, in this case, the non-volcanic, non-bucket-adjustment periods is short. If it gets too short, the whole test is beyond weird.
Still, what can be said is the “weather only” during the non-stratospheric volcano period we *have* looks pretty small!
May 30th, 2008 at 11:53 am
# C. The proposed adjustment is wildly off (I’d welcome other suggestions for an adjustment)# SUGGESTION: Please don’t, any adjustment of historical SST will be of little help.
First of all, the SST drop was not a drop but a rise in the late 1941 (uncorrected on a global basis ca. 0.8 degrees), which dropped about 0.4 degree at about 1946. Actually the situation seem to have been much more complex, http://www.oceanclimate.de/English/Pacific_SST_1997.pdf and http://www.oceanclimate.de/English/Atlantic_SST_1998.pdf , as not only during that time period the conditions differed from ship to ship extremely, but continued with the increasing size and speed of the ships since the 1950s. In the vastness of the ocean space and volume, the comparability of data, summing them up in series, presumably make any adjustment speculative. It should be furthermore taken into account that only recently the New Scientist (issue 2652) reported about ‚Mysterious striped currents revealed in the oceans’. http://www.soest.hawaii.edu/soest_web/images/Maximenko_Uga_eqrec_1000px.jpg . Should this extraordinary finding not be included in any research planning before considering any adjustment of historical SST?
Indeed: # the historic data is pretty thorny; lucia at May 29, 2008 12:08 PM #
May 30th, 2008 at 3:01 pm
ya lucia, A while back I did a compilation
of all trends in the record, 2 year, 3 year 4 year up to 10 year. If the post 40s patch of cooling turns out to be intrument/data analysis error, then the frequency of 7 year cooling patches will decrease, making thereby these past 7 years a bit of an oddity, or rather more of an oddity. Non volcanic induced cooling regimes. Shrugs. what to make of that?