Normalized U.S. Earthquake Losses: 1900-2005
June 18th, 2008Posted by: Roger Pielke, Jr.
Kevin Vranes and I have just had a paper accepted for publication on historical earthquake losses in the United States.
Vranes, K., and R. A. Pielke, Jr., 2008 (in press). Normalized earthquake damage and fatalities in the United States: 1900 – 2005, Natural Hazards Review. (PDF)
The dataset that we present in the paper will allow for a range of interesting analyses. Here is the abstract:
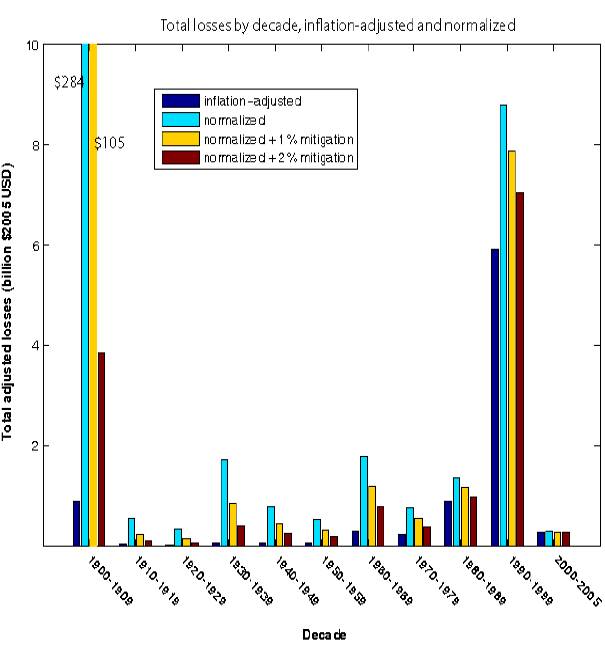
Damage estimates from 80 United States earthquakes since 1900 are “normalized” to 2005 dollars by adjusting for inflation, increases in wealth and changes in population. A factors accounting for mitigation at 1% and 2% loss reduction per year are also considered. The earthquake damage record is incomplete, perhaps by up to 25% of total events that cause damage, but all of the most damaging
events are accounted for. For events with damage estimates, cumulative normalized losses since 1900 total $453 billion, or $235 billion and $143 billion when 1% and 2% mitigation is factored respectively. The 1906 San Francisco earthquake and fire adjusts to $39 – $328 billion depending on assumptions and mitigation factors used, likely the most costly natural disaster in U.S. history in normalized 2005 values. Since 1900, 13 events would have caused $1B or more in losses had they
occurred in 2005; five events adjust to more than $10 billion in damages. Annual average losses range from $1.3 billion to $5.7 billion with an average across datasets and calculation methods of $2.5 billion, below catastrophe model estimates and estimates of average annual losses from hurricanes. Fatalities are adjusted for population increase and mitigation, with five events causing over 100 fatalities when mitigation is not considered, four (three) events when 1% (2%) mitigation is considered. Fatalities in the 1906 San Francisco event adjusts from 3,000 to over 24,000, or 8,900 (3,300) if 1% (2%) mitigation is considered. Implications for comparisons of normalized results with catastrophe model output and with normalized damage profiles of other hazards are considered.
June 18th, 2008 at 12:36 pm
Has there been a similar analysis done for flood?
I know that you have done some for hurricane. And that you have a post for flood which isn’t has complete as this one.
June 18th, 2008 at 12:52 pm
Sylvain-
Floods are much more complicated, the closest similar analyses we have for floods are the following:
Downton, M. and R.A. Pielke, Jr., 2001. Discretion Without Accountability: Politics, Flood Damage, and Climate, Natural Hazards Review, 2(4):157-166.
http://sciencepolicy.colorado.edu/admin/publication_files/resource-34-2001.03.pdf
Pielke, Jr., R. A. and M.W. Downton, 2000. Precipitation and Damaging Floods: Trends in the United States, 1932-97. Journal of Climate, 13(20), 3625-3637.
http://sciencepolicy.colorado.edu/admin/publication_files/resource-60-2000.11.pdf
June 18th, 2008 at 2:12 pm
Thanks for the quick reply.
I have one question though:
Figure 4 from the first paper and figure 3a from the second paper.
Figure 3a shows an increase in per capita losses, but when I look at figure 4 the increase in damage follow pretty much the increase in population which should show no trend for per capita. I don’t know how to calculate this to verify it.
Is there a discrepancies between the 2 graphs or is figure 4 a simple residual effect (not sure how to describe this.
June 18th, 2008 at 3:48 pm
Sylvain- They are in fact the same data. The per capita losses increase at a rate about 60% less than the inflation-only adjusted data. So damages do increase with population, but tehre is a residual trend.
June 18th, 2008 at 6:50 pm
Thanks I think I understand this better.
Just to be sure though.
In the last century per capita damages have risen, but the rise isn’t limited to precipitation increase.
I have also that realized that the 2 line in figure 4 are not on the same scale.