|
|
|
|
|
|
|
|
|
|
|
|
|
|
|
|
|
|
|
|
|
|
|
|
|
Flood Damage in the United States, 1926-2003 5. Accuracy of Damage Estimates In general, estimates of damage contain a high degree of uncertainty. Ideally, estimation errors would be measured by systematically comparing estimates with actual costs, which often are not known until long after a flood event. Unfortunately, actual cost data are seldom collected in a form that can be compared with estimates made at the time of the flood. This section examines the accuracy of flood damage estimates in two ways: (1) by comparing estimates with actual costs in one large flood disaster, and (2) by comparing pairs of estimates from different sources for many flood events. A. Errors in Early Damage Estimates NWS flood damage estimates are usually compiled within three months after a flood event, long before the actual costs can be known. Until recently, even in serious disasters, actual total damage costs were not systematically compiled by any agency. There was no way of checking the accuracy, or even the reasonableness, of most damage estimates. In recent years, however, FEMA has systematically collected cost data for the programs it administers - admittedly only a fraction of total disaster costs. Beginning in 1992, FEMA instituted a computerized system for recording and tracking applications for federal assistance in presidentially declared disasters. State and county governments have gradually developed the capabilities to link to this system. The damage estimates submitted by local officials to FEMA probably represent the best available early estimates under disaster conditions. A team visits each damage site to view the extent of losses and make preliminary estimates. Thus, in some disasters and some jurisdictions, it is now possible to systematically compare early damage estimates with actual costs. Data from FEMA's Public Assistance Program are particularly appropriate for our purposes because a large portion of the losses involve physical damage to property. Public assistance covers damage to public facilities such as roads and bridges, schools, government buildings, and nonprofit agencies. In the aftermath of a natural disaster, damage information is assembled according to guidelines established by FEMA. The following stages are described by FEMA (1998) and Michael Sabbaghian1 of the California Office of Emergency Services (OES) (personal communication 8/30/00).
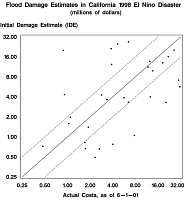
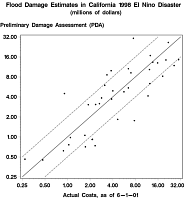
Descriptions of the NWS procedures for obtaining flood damage estimates suggest that, in most cases, the estimates have been qualitatively similar to the IDE and certainly no better than the PDA. Indeed, NWS field offices obtain some of their estimates from FEMA's survey teams (Section 2). Only in the largest floods (notably, the widespread flooding of the upper Mississippi basin in 1993) have extensive efforts been made to update the damage estimates over an extended period. Therefore, to estimate the errors in early damage estimates that can be expected under good conditions (that is, from officials who have systematically viewed the damage), we use FEMA records from a recent flood disaster as a case study. In February 1998, winter storms with heavy rains led to widespread flooding in California. The president declared a major disaster in 41 counties, designated the "1998 California El Niño" disaster (FEMA-1203-DR). Table 5-1 shows the IDE and PDA estimates for each county under the public assistance program. It also shows the funds that had been obligated in the FEMA database as of June 1, 2001. Although the DSR has not been closed at the time of this writing, it is expected that nearly all costs have been obligated; therefore we will treat these figures as the "actual costs." The bottom line of Table 5-1 shows that total public assistance costs in the state were approximately $316 million. The PDA underestimated the total costs by only 6% ($19 million). Because no IDE was provided for several counties, the total IDE of $240 million should be compared with the total actual cost of $279 million from the matching 33 table entries. On that basis, the IDE underestimated total costs by about 14% ($39 million). Estimates for smaller units (individual counties and the "state agencies" category) are much less accurate, however. Errors in the IDE are particularly large, ranging from underestimation by $26 million (82%) in Los Angeles County to overestimation by $20 million (316%) in San Benito County. In the PDA, errors range from underestimation by $16 million (52%) in the state agencies category to overestimation by $23 million (304%) in San Bernardino County. Table 5-1. California 1998 El Niño Disaster: Estimated and actual public assistance costs, in thousands of current dollars.
|
||||||||||||||||||||||||||||||||||||||||||||||||||||||||||||||||||||||||||||||||||||||||||||||||||||||||||||||||||||||||||||||||||||||||||||||||||||||||||||||||||||||||||||||||||||||||||||||||||||||||||||||||||||||||||||||||||||||||||||||||||||||||||||||||||||||||||||
|
* Proportion of actual cost ($279 million) of cases with an IDE. Figures 5-1(a,b) show scatterplots of (a) the IDE vs. actual costs and (b) the PDA vs. actual costs. Logarithmic scales are used on the axes to highlight proportional differences between estimates and actual costs. The solid diagonal line represents perfect agreement. Data points outside of the two dashed lines are cases in which the estimate differs from the actual costs by more than a factor of two. Clearly the IDE is less accurate than the PDA: the points are much more scattered. (Correlations between the logs of estimates and actual costs are r = 0.46 for the IDE and 0.88 for the PDA.) Since the Initial Damage Estimates are based on rather superficial damage descriptions, it is not surprising that large errors are the norm: Over half of the IDEs (18 out of 33) are off by at least a factor of two, and 13 of them are off by more than a factor of four. As a percentage of the actual costs, the IDE errors can be enormous, ranging from a 99.5% underestimate in Santa Barbara County to a 2170% overestimate in Tehama County. The Preliminary Damage Assessments are somewhat better, yet over one-third (15 out of 42) are off by at least a factor of two and 3 of them are off by more than a factor of four. The PDA errors range from a 77% underestimate in Humboldt County to a 393% overestimate in Yolo County. The population of some California counties exceeds that of many small states. So estimation errors in the larger counties are indicative of the error levels to be expected in many states. For example, Los Angeles County, with a 1990 population of 8.9 million, is larger than 42 of the states. Table 5-1 shows that, in this disaster, the IDE underestimated actual costs by 82%. To check for systematic bias in these early damage estimates, we used a statistical paired-comparison test. A systematic tendency to underestimate might be expected if some types of damage cannot be observed without careful inspection. On the other hand, we wondered if there might be a tendency for local officials to overestimate damage in order to increase the chance of being considered for federal aid. The IDE and PDA estimates were compared with actual costs, as follows: Let ei = estimated damage, ai = actual cost. We wish to test the null hypothesis that the geometric mean of ei/ai = 1. This is equivalent to the hypothesis that mean[log(ei) - log(ai)] = 0. We tested the hypothesis twice, first letting ei represent the IDE values in Table 5-1 (N = 33), then letting ei represent the PDA values (N = 42). A t-test is appropriate, even in these small samples, because the sample values log(ei) - log(ai) are approximately normally distributed. For the IDE, t = -1.27, and for the PDA, t = -1.10, neither of which is statistically significant at a 95% confidence level. Though there may be a tendency to underestimate the amount of damage, the bias is not statistically significant. In summary, this example indicates that positive and negative estimation errors tend to average out when estimates are highly aggregated in a large flood event (over $300 million damage in 1998 dollars, in this case). The initial rough estimates (IDE) tended to underestimate actual damage and the more careful PDA estimates were reasonably accurate. It shows, however, that in smaller flood events ($30 million damage or less in 1998 dollars), which involve substantially less aggregation, the errors can be extremely large. Half of the PDA estimates were in error by more than a factor of 1.5; and half of the IDEs were in error by more than a factor of 2 (with many off by more than a factor of 4). Figure 5-1. Estimated flood damage in California counties in the 1998 El Niño disaster, compared with actual costs as of June 1, 2001: (Click on thumbnail images to enlarge images.)
|
||||||||||||||||||||||||||||||||||||||||||||||||||||||||||||||||||||||||||||||||||||||||||||||||||||||||||||||||||||||||||||||||||||||||||||||||||||||||||||||||||||||||||||||||||||||||||||||||||||||||||||||||||||||||||||||||||||||||||||||||||||||||||||||||||||||||||||
|
Given the methods used by NWS field offices to obtain flood damage estimates (described in Section 2), it is unlikely that the NWS estimates are much better than the IDEs examined here. Thus, when an annual flood damage estimate for a state is less than about $30 million, one should not expect the NWS estimate to depict actual losses accurately. However, the above analysis does not indicate systematic bias in the individual estimates, and errors tend to average out when the estimates are summed. From the above results, we conclude that aggregation of many damage estimates in floods that have caused high levels of damage ($300 million or more in 1998 dollars) provides reasonably good estimates of total damage. However, estimates at a low level of aggregation ($30 million or less) often are in error by factors of 2 or more. Such small estimates should be used with great caution: Direct comparisons of individual estimates are likely to be misleading. B. Comparison of Damage Estimates from NWS and States Appropriate data are not available for comparing NWS estimates with actual flood damage costs. However, comparable estimates are available from independent state sources to do an assessment of typical estimation variability. Every state in the U.S. has an emergency management agency. In July 2000, we wrote to the head of the emergency management agency in each state asking for historical data on flood damage in their state. The letter was followed by a phone call to the appropriate administrator if a response was not received within three weeks. Twenty-one states responded2, but many of them could provide damage information only after 1990 and only related to losses covered by FEMA. Five states either had published historical summaries of flood damage or were able to compile flood damage estimates from their files covering at least 20 years which were based on criteria similar to those used by the NWS.
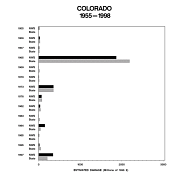
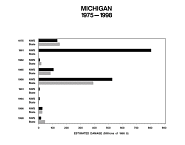
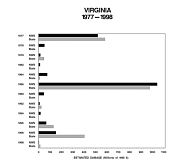
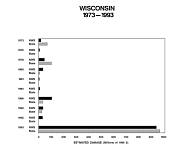
In the state reports, the loss estimates are provided for each major flood event, sometimes with two or more events occurring in a given year. To match the annual loss estimates provided by NWS-HIC, we added up the flood losses in each state for each year, using calendar years during 1955-1982 and fiscal years (Oct-Sep) during 1983-1998 to match the time periods used in the NWS estimates3. Our comparison covers a total of 155 years in the 5 states: 44 years each in California and Colorado (1955-1998), 24 years in Michigan (1975-1998), 22 years in Virginia (1977-1998), and 21 years in Wisconsin (1973-1993). Of course, the state estimates are subject to the same types of error as the NWS estimates - neither is assumed a priori to be more accurate. The intent of this section is to investigate large discrepancies between estimates from different sources in order to understand how estimates of the same event vary and to determine whether some floods are overlooked. In the following analysis, all loss estimates are reported in inflation-adjusted 1995 dollars. When estimates are very low or missing: Table 5-2 provides a comparison of the estimates in all 155 years, with cases along the diagonal (from upper-left to lower-right) showing the closest agreement. An obvious difference between the NWS and state estimates is in the amount of missing data - a result of different purposes of the data. NWS flood loss estimates are collected every year, with relatively small losses included; hence, estimates are missing or zero in only 28 years and are below $5 million in 56 years. In contrast, the state reports focus on more serious floods, so years of relatively low flood loss are not included. The states did not report losses in 91 cases, and included losses below $5 million in only 6 cases4. The threshold for reporting appears to be somewhat higher in California, where the lowest reported loss was $15 million. We conclude that these five states do not attach great importance to floods that cause less than $5 million in damage; therefore, annual losses below that threshold will be described as "low" flood losses. Lumping the low and missing categories together, the NWS and states agree that 78 (50%) of the 155 cases involved little or no flood damage. Disagreements arise, however, when at least one estimate is above $5 million. Table 5-2. Crosstabulation of flood damage estimates from the NWS and five states. Estimates are in millions of 1995 dollars.
|
||||||||||||||||||||||||||||||||||||||||||||||||||||||||||||||||||||||||||||||||||||||||||||||||||||||||||||||||||||||||||||||||||||||||||||||||||||||||||||||||||||||||||||||||||||||||||||||||||||||||||||||||||||||||||||||||||||||||||||||||||||||||||||||||||||||||||||
|
Disagreement #1: State estimate above $5 million, NWS estimate missing or low.
Disagreement #2: NWS estimate above $5 million, state estimate missing or low.
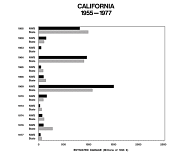
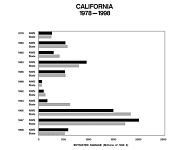
Comparisons of estimates: For California, Figures 5-2(a,b) show cases in which at least one estimate is greater than $50 million. For the other states, Figures 5-2(c-f) show cases in which at least one estimate is greater than $5 million. Visually, the graphs are dominated by the major floods (over $500 million), where most of the disagreements appear to be relatively small (except for the erroneous estimate we have already noted for Michigan in 1981). At the moderate-to-high damage levels ($5-500 million), however, some differences are proportionately large. For example, estimates differ by more than a factor of two in California in 1965, 1973, 1976 and 1993, Colorado in 1984 and 1995, Michigan in 1982 and 1998, Virginia in 1979, 1984, 1992 and 1996, and Wisconsin in 1973, 1978, 1980 and 1986. Figure 5-2. Comparison of National Weather Service flood damage estimates with estimates obtained from five states: (Click on thumbnail images to enlarge images.)
|
||||||||||||||||||||||||||||||||||||||||||||||||||||||||||||||||||||||||||||||||||||||||||||||||||||||||||||||||||||||||||||||||||||||||||||||||||||||||||||||||||||||||||||||||||||||||||||||||||||||||||||||||||||||||||||||||||||||||||||||||||||||||||||||||||||||||||||
|
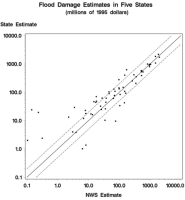
Figure 5-3 is a scatterplot of all cases that have estimates from both NWS and the state. Logarithmic scales are used on the axes to highlight proportional differences in the estimates. The solid diagonal line represents perfect agreement between the estimates. Data points outside of the two dashed lines are cases in which the estimates differ by more than a factor of two. Seventeen cases are above the upper dashed line, representing state estimates more than twice as large as the NWS estimate. Six cases are below the lower dashed line, with NWS estimates more than twice as large as the state estimate. The closest agreement between state and NWS estimates occurred in floods involving major damage (over $500 million). At the other extreme, the largest proportional disagreements (cases farthest outside the dashed lines) occurred when both sources indicated that flood damage was low or moderate (under $50 million). From the standpoint of the NWS estimates, when the NWS damage estimate was:
There are many plausible explanations why agreement might improve as total damage increases. First, the crisis of a major flood spurs studies by numerous agencies. Collection of damage information is more likely to be systematic and complete in a major flood than in a smaller one. Second, agencies are more likely to share information about major floods (which would lead to increased agreement, but does not guarantee greater accuracy). In smaller floods, on the other hand, collection of damage information is likely to be haphazard and there is less interest in checking and correcting early damage estimates. Third, the damage in large floods is aggregated from many individual damage estimates so that random errors tend to cancel out. Small floods involve less aggregation and, hence, relatively larger errors. C. Accuracy: Summary and Conclusions The following conclusions are drawn from the analysis of accuracy and consistency presented in Sections 4 and 5.
|
||||||||||||||||||||||||||||||||||||||||||||||||||||||||||||||||||||||||||||||||||||||||||||||||||||||||||||||||||||||||||||||||||||||||||||||||||||||||||||||||||||||||||||||||||||||||||||||||||||||||||||||||||||||||||||||||||||||||||||||||||||||||||||||||||||||||||||
|
||||||||||||||||||||||||||||||||||||||||||||||||||||||||||||||||||||||||||||||||||||||||||||||||||||||||||||||||||||||||||||||||||||||||||||||||||||||||||||||||||||||||||||||||||||||||||||||||||||||||||||||||||||||||||||||||||||||||||||||||||||||||||||||||||||||||||||

A report of the University Corporation for Atmospheric Research, supported by the National Science Foundation, the National Weather Service, and the National Oceanic and Atmospheric Administration, Office of Global Programs, pursuant to NOAA Award No. NA96GP0451 through a cooperative agreement. In partnership between the Environmental and Societal Impacts Group of the National Center for Atmospheric Research and the Center for Science and Technology Policy Research, Cooperative Institute for Research in Environmental Sciences, University of Colorado.
A report of the University Corporation for Atmospheric Research, supported by the National Science Foundation, the National Weather Service, and the National Oceanic and Atmospheric Administration, Office of Global Programs, pursuant to NOAA Award No. NA96GP0451 through a cooperative agreement. In partnership between the Environmental and Societal Impacts Group of the National Center for Atmospheric Research and the Center for Science and Technology Policy Research, Cooperative Institute for Research in Environmental Sciences, University of Colorado.
