|
|
|
|
|
|
|
|
|
|
|
|
|
|
|
|
|
|
|
|
|
|
|
|
|
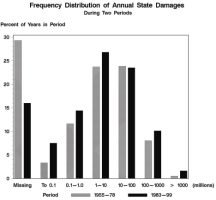
Flood Damage in the United States, 1926-2003 6. Dealing with Data Omissions and Inconsistencies Used appropriately, reanalyzed NWS damage estimates can provide valuable information about historical flood damage in the U.S. But users should be aware of the deficiencies in the damage data sets and choose methods of analysis that guard against misleading results. Omissions and inconsistencies are of particular concern if they introduce systematic biases in the damage estimates that might distort comparisons of flood damage between different time periods or locations. This chapter examines frequency distributions of state damage estimates to evaluate the impact of omissions and inconsistencies and to suggest appropriate methods of analysis. A. Frequency of Damaging Floods at the State Level Few states report flood damage every year; indeed, many states experience damaging floods rather infrequently. In studying the flood damage history of a state or region, it is of interest to know how often damaging floods occur. However, the lack of a damage estimate does not necessarily imply zero flood damage because reporting of dollar damages, particularly in small flood events, is somewhat unreliable. To assure consistent comparisons across different times and locations, it would be helpful to know what levels of damage have been reported fairly consistently. The NWS defines its flood damage data as "loss estimates for significant flooding events" (NWS-HIC 2001). Floods that cause deaths or extensive damage have always received the most attention, but the records do not indicate any formal criteria on which floods to include. When small estimates are submitted, NWS-HIC has usually included them in the damage totals. (An exception occurred during 1993-1998, when local damage estimates below $50,000 were not entered in the flood damage database.) However, field office reports often mention damage without providing dollar estimates. When pressed for a definition of which floods are "significant" enough that intensive efforts are made to obtain complete estimates, NWS-HIC Director Frank Richards offered a rough guideline of at least $1 million in losses (personal communication, 6/27/01). This applies to NWS practice since 1990, but earlier guidelines, if used, are unknown. Frequency distributions of state flood damage estimates suggest that floods with total state damage less than $100,000 (in 1995 dollars) have often gone unreported, and those under $1 million also have sometimes been omitted. Figure 6-1 shows the distribution of all state flood damage estimates in recent years (1983-1999) and in an earlier period (1955-1978). Estimates were missing nearly 30% of the time in the earlier period, and only 16% of the time in recent years. This could imply either fewer damaging floods or different reporting standards in the earlier period - perhaps both. Because the early period had a high frequency of flood damage over $1 million, it is unlikely that the incidence of damage less than $1 million was as small as the distribution suggests. It is likely that lower level damages were not consistently reported before 1980. Figure 6-1. Frequency distributions of annual state flood damages (1995 dollars), 1955-1978 and 1983-1999. (Click on thumbnail image to enlarge image.)
|
|||||||||||||||||||||||||||||||||||||||||||||||||||||||||||||||||||||||||||||||||||||||||||||||||||||||||||||||||||||||||||||||||||||||||||||||||||||||||||||||||||||||||||||||||||||||||||||||||||||||||||||||||||||||||||||||||||||||||||||||||||||||||||||||||||||||||||||||||||||||||||||||||||||||||||||||||||||||||||||||||||||||||||||||||||||||||||||||||||||
|
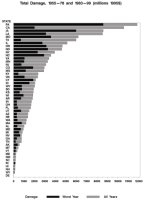
For determining the frequency of damaging floods, we recommend establishing a threshold above which damage estimates are expected to be provided consistently. In our analysis we have chosen to use the frequency of inflation-adjusted state flood damage estimates above $1 million. B. Magnitude of Damages Individual states differ greatly, both in flood frequency and in the magnitude of damage in a "typical" flood event. Figure 6-2 shows, for each state, the estimated total damage during the years 1955-1978 and 1983-1999, as well as the damage in the worst flood year. A few states have had many major floods (e.g. California, Texas). Many others have suffered most of their total damage in just one or two major flood events (including Pennsylvania and Iowa, among the worst in total damage). Many states had no yearly damage greater than $500 million in this period, and there are 10 states whose total damage for the entire 41-year period is less than $500 million. These state comparisons do not include 1979 damage estimates because some estimates for that year are available only for large regions, not for individual states (see Section 3). Estimates of 1979 damage are available for many states, however, and are useful to illustrate how rankings of states by total damage can differ depending on the time period covered. For example, 1979 flood damage in Texas was $3.76 billion - substantially greater than in any of the years included in Figure 6-2. Texas would move from 6th to 3rd place in the rankings if 1979 were included. The frequency distributions of flood damage in each state give another perspective on past flood vulnerability. Table 6-1 shows how states differ in both frequency and severity of damaging floods during 1955-1978 and 1983-1999. The states are ordered by their median annual flood damage based on all 41 years, including years with no reported damage. The number of missing, very low (< $1 million) and relatively high (> $100 million) damage estimates are shown to indicate both frequency and relative magnitudes of flood damage. Three "historical vulnerability categories" can be loosely defined to illustrate the differences between states. (Although the worst flood, indicated by maximum damage, is shown for each state, it is not considered in defining historical categories.)
Figure 6-2. States ranked by estimated total damage during 1955-1978 and 1983-1999. (Click on thumbnail image to enlarge image.)
|
|||||||||||||||||||||||||||||||||||||||||||||||||||||||||||||||||||||||||||||||||||||||||||||||||||||||||||||||||||||||||||||||||||||||||||||||||||||||||||||||||||||||||||||||||||||||||||||||||||||||||||||||||||||||||||||||||||||||||||||||||||||||||||||||||||||||||||||||||||||||||||||||||||||||||||||||||||||||||||||||||||||||||||||||||||||||||||||||||||||
|
Table 6-1. Comparison of Damage Estimates by State, 1955-1978 and 1983-1999. (States are ordered by increasing median damage. Missing estimates are treated as zero; all estimates are in millions of 1995 dollars.)
|
|||||||||||||||||||||||||||||||||||||||||||||||||||||||||||||||||||||||||||||||||||||||||||||||||||||||||||||||||||||||||||||||||||||||||||||||||||||||||||||||||||||||||||||||||||||||||||||||||||||||||||||||||||||||||||||||||||||||||||||||||||||||||||||||||||||||||||||||||||||||||||||||||||||||||||||||||||||||||||||||||||||||||||||||||||||||||||||||||||||
|
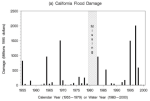
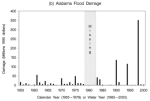
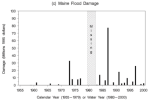
* Estimates of maximum damage can be misleading. For example, in Idaho the maximum was caused by failure of the Teton Dam in 1976; the worst damage directly from precipitation and streamflow is estimated at $120 million. In Texas, the maximum appears small but much greater damage occurred in a year not covered by this table ($3.76 billion in 1979). Perception of flood damage in a state is influenced by historical experience. A state’s median damage can be taken as the expectation of the flood damage threat in a "typical" year, its maximum damage as the public view of a "major flood". These categories are useful in describing how state perspectives on flood damage might differ. Although some states in each category have experienced massive flood damage (over, say, $1 billion), such damage occurs most frequently in the high vulnerability category. One might expect that reporting of flood damage by NWS field offices would be influenced by the flood history of an area. In low vulnerability states, floods causing over $1 million damage are notable events and seem unlikely to go unreported. Conversely, in high vulnerability states, damage of $5 million or more occurs frequently so smaller damages might seem unremarkable and be easily ignored. However, the analysis in Section 5 indicates that these expectations are false. In California, a high vulnerability state, the NWS often reports damage under $5 million, but no NWS estimates were provided in two years when the state claimed substantial damage (1979 and 1984)5. Likewise in Colorado, a low vulnerability state, damage of $24 million went virtually unreported in 1983 (the NWS estimate is $140,000). From these examples and others in Section 5, we conclude that omissions of estimates in the $5 - 25 million range in the NWS data sets are not systematically related to the size of a state or its typical damage level; rather, the omissions can be considered random inconsistencies in data collection operations. C. Implications for Analysis of State Damages States typical of the three vulnerability categories are shown in Figures 6-3(a-c) and Table 6-2. California represents the high vulnerability states, Alabama the medium vulnerability states, and Maine the low vulnerability states. In all three states, damage totals for the full 41 year period (Table 6-2) would be affected little by occasional omission of damage under $1 million. Indeed, California and Alabama totals would be affected little by a few $25 million omissions. But in Maine, a $25 million flood is relatively large, representing over 10% of total damage. Its omission could greatly influence the result of, say, a comparison of damages during two time periods. Furthermore, since floods in Maine involve relatively low damage there is less aggregation of damage estimates, therefore less tendency for errors to average out. For low vulnerability regions, we recommend spatial aggregation to reduce the impact of errors and omissions. Several contiguous regional groupings of states with similar frequency distributions are suggested in the second column of Table 6-1. For example, estimates of damage in New England are expected to be more reliable than estimates of damage in Maine. Other groupings might be appropriate depending on the purpose of a particular analysis. Table 6-2. Levels of annual state flood damage in three states, during all years, 1955-1978 and 1983-1999.
|
|||||||||||||||||||||||||||||||||||||||||||||||||||||||||||||||||||||||||||||||||||||||||||||||||||||||||||||||||||||||||||||||||||||||||||||||||||||||||||||||||||||||||||||||||||||||||||||||||||||||||||||||||||||||||||||||||||||||||||||||||||||||||||||||||||||||||||||||||||||||||||||||||||||||||||||||||||||||||||||||||||||||||||||||||||||||||||||||||||||
|
Figure 6-3. Historical flood damage in states representing different levels of vulnerability: (Click on thumbnail images to enlarge images.)
|
|||||||||||||||||||||||||||||||||||||||||||||||||||||||||||||||||||||||||||||||||||||||||||||||||||||||||||||||||||||||||||||||||||||||||||||||||||||||||||||||||||||||||||||||||||||||||||||||||||||||||||||||||||||||||||||||||||||||||||||||||||||||||||||||||||||||||||||||||||||||||||||||||||||||||||||||||||||||||||||||||||||||||||||||||||||||||||||||||||||
|
D. Recommendations In summary, the following two procedures are recommended to reduce the impact of errors and omissions in the NWS state damage estimates:
|
|||||||||||||||||||||||||||||||||||||||||||||||||||||||||||||||||||||||||||||||||||||||||||||||||||||||||||||||||||||||||||||||||||||||||||||||||||||||||||||||||||||||||||||||||||||||||||||||||||||||||||||||||||||||||||||||||||||||||||||||||||||||||||||||||||||||||||||||||||||||||||||||||||||||||||||||||||||||||||||||||||||||||||||||||||||||||||||||||||||

A report of the University Corporation for Atmospheric Research, supported by the National Science Foundation, the National Weather Service, and the National Oceanic and Atmospheric Administration, Office of Global Programs, pursuant to NOAA Award No. NA96GP0451 through a cooperative agreement. In partnership between the Environmental and Societal Impacts Group of the National Center for Atmospheric Research and the Center for Science and Technology Policy Research, Cooperative Institute for Research in Environmental Sciences, University of Colorado.
A report of the University Corporation for Atmospheric Research, supported by the National Science Foundation, the National Weather Service, and the National Oceanic and Atmospheric Administration, Office of Global Programs, pursuant to NOAA Award No. NA96GP0451 through a cooperative agreement. In partnership between the Environmental and Societal Impacts Group of the National Center for Atmospheric Research and the Center for Science and Technology Policy Research, Cooperative Institute for Research in Environmental Sciences, University of Colorado.